
Page 345 - Tata Chemical Annual Report_2022-2023
P. 345
Integrated Annual Report 2022-23 01-83 84-192 193-365
Integrated Report Statutory Reports Financial Statements
Consolidated
(E) The defined benefit scheme is administered by a fund that is legally separated from the Group. Responsibility for governance of 4. Other information
the scheme lies with the board of trustees. The board of trustees must be composed of representatives of the Group and scheme ` in crore
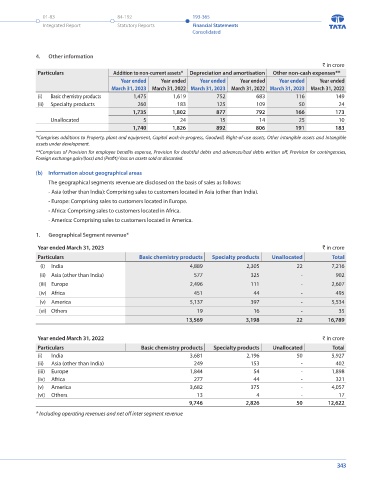
participants in accordance with the scheme rules and on timely basis, the board of trustees reviews the level of funding for the Particulars Addition to non-current assets* Depreciation and amortisation Other non-cash expenses**
scheme as required by legislation. Such a review includes the asset-liabilities matching strategy and investment risk management Year ended Year ended Year ended Year ended Year ended Year ended
policy and is used to determine the schedule of contributions payable by and agreed with the Group. March 31, 2023 March 31, 2022 March 31, 2023 March 31, 2022 March 31, 2023 March 31, 2022
(i) Basic chemistry products 1,475 1,619 752 683 116 149
41. Segment information (ii) Specialty products 260 183 125 109 50 24
41.1 Continuing operations 1,735 1,802 877 792 166 173
(a) Information about operating segments Unallocated 5 24 15 14 25 10
The Company has 2 reportable segments which are the Company's strategic business units. These business units offer different 1,740 1,826 892 806 191 183
products and are managed separately. Reportable Segments approved by Board of Directors are as under: *Comprises additions to Property, plant and equipment, Capital work-in-progress, Goodwill, Right-of-use assets, Other intangible assets and Intangible
assets under development.
- Basic chemistry products - Soda Ash, Salt and other bulk chemicals
**Comprises of Provision for employee benefits expense, Provision for doubtful debts and advances/bad debts written off, Provision for contingencies,
- Specialty products - Nutrition solutions, agri Solutions, advance materials, etc. Foreign exchange gain/(loss) and (Profit)/ loss on assets sold or discarded.
` in crore
Year ended Year ended (b) Information about geographical areas
Particulars
March 31, 2023 March 31, 2022 The geographical segments revenue are disclosed on the basis of sales as follows:
1. Segment revenue (Revenue from operations) - Asia (other than India): Comprising sales to customers located in Asia (other than India).
(i) Basic chemistry products 13,597 9,758 - Europe: Comprising sales to customers located in Europe.
(ii) Specialty products 3,198 2,826 - Africa: Comprising sales to customers located in Africa.
16,795 12,584
Inter segment revenue (28) (12) - America: Comprising sales to customers located in America.
16,767 12,572
Unallocated 22 50 1. Geographical Segment revenue*
16,789 12,622 Year ended March 31, 2023 ` in crore
2. Segment result (Reconciliation with profit from continuing operations) Particulars Basic chemistry products Specialty products Unallocated Total
(i) Basic chemistry products (note 34) 3,028 1,486 (i) India 4,889 2,305 22 7,216
(ii) Specialty products 91 168
Total Segment results 3,119 1,654 (ii) Asia (other than India) 577 325 - 902
Net unallocated income/(expenditure) 29 90 (iii) Europe 2,496 111 - 2,607
Finance costs (406) (303) (iv) Africa 451 44 - 495
Profit before share of profit/loss from investment in joint ventures and 2,742 1,441 (v) America 5,137 397 - 5,534
associate and tax (vi) Others 19 16 - 35
Share of Profit/(loss) of joint ventures and associate (net of tax) (2) 226 13,569 3,198 22 16,789
Tax expense (288) (267)
Profit for the year from continuing operations 2,452 1,400
Year ended March 31, 2022 ` in crore
3. Segment assets and segment liabilities* Particulars Basic chemistry products Specialty products Unallocated Total
` in crore (i) India 3,681 2,196 50 5,927
Segment assets Segment liabilities (ii) Asia (other than India) 249 153 - 402
Particulars As at As at As at As at (iii) Europe 1,844 54 - 1,898
March 31, 2023 March 31, 2022 March 31, 2023 March 31, 2022 (iv) Africa 277 44 - 321
(i) Basic chemistry products 22,177 19,475 4,494 4,018 (v) America 3,682 375 - 4,057
(ii) Specialty products 3,112 3,216 959 1,084 (vi) Others 13 4 - 17
25,289 22,691 5,453 5,102 9,746 2,826 50 12,622
Unallocated 9,795 11,152 8,989 9,584 * Including operating revenues and net off inter segment revenue
35,084 33,843 14,442 14,686
* Including assets held for sale
342 343