Page 346 - Tata Chemical Annual Report_2022-2023
P. 346
Integrated Annual Report 2022-23 01-83 84-192 193-365
Integrated Report Statutory Reports Financial Statements
Consolidated
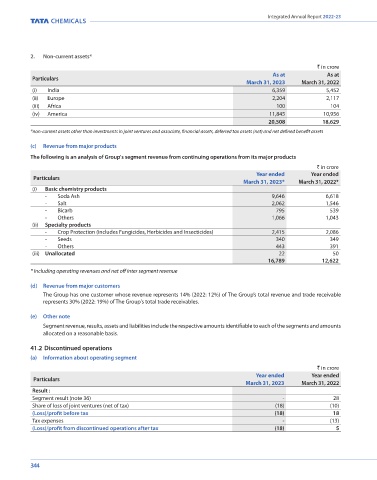
2. Non-current assets* 41.3 Reconciliation of information on reportable segment to Consolidated Balance Sheet and Consolidated
` in crore Statement of Profit and Loss
As at As at (a) Reconciliation of profit for the year as per Consolidated Statement of Profit and Loss
Particulars
March 31, 2023 March 31, 2022 ` in crore
(i) India 6,359 5,452 Particulars Year ended Year ended
(ii) Europe 2,204 2,117 March 31, 2023 March 31, 2022
(iii) Africa 100 104 Profit for the year from continuing operations (note 41.1(a)(2)) 2,452 1,400
(iv) America 11,845 10,956 Profit for the year from discontinued operations (note 41.2(a)) (18) 5
20,508 18,629 Profit for the year as per Consolidated Statement of Profit and Loss 2,434 1,405
*non-current assets other than investments in joint ventures and associate, financial assets, deferred tax assets (net) and net defined benefit assets (b) Reconciliation of total assets as per Consolidated Balance Sheet
` in crore
(c) Revenue from major products As at As at
Particulars
The following is an analysis of Group's segment revenue from continuing operations from its major products March 31, 2023 March 31, 2022
` in crore Total assets as per continuing operations (note 41.1 (a) (3)) 35,084 33,843
Year ended Year ended Total assets as per Consolidated Balance Sheet 35,084 33,843
Particulars
March 31, 2023* March 31, 2022*
(i) Basic chemistry products (c) Reconciliation of total liabilities as per Consolidated Balance Sheet
- Soda Ash 9,646 6,618 ` in crore
- Salt 2,062 1,546 Particulars As at As at
- Bicarb 795 539 March 31, 2023 March 31, 2022
- Others 1,066 1,043 Total liabilities as per continuing operations (note 41.1 (a) (3)) 14,442 14,686
(ii) Specialty products Total liabilities as per Consolidated Balance Sheet 14,442 14,686
- Crop Protection (includes Fungicides, Herbicides and Insecticides) 2,415 2,086
- Seeds 340 349 42. Derivative financial instruments and hedging activities
- Others 443 391 (a) The details of the various outstanding derivative financial instruments are given below:
(iii) Unallocated 22 50 ` in crore
16,789 12,622 As at March 31, 2023 As at March 31, 2022
* Including operating revenues and net off inter segment revenue Particulars Assets Liabilities Assets Liabilities
Current portion
(d) Revenue from major customers Derivatives designated in cash flow hedges
The Group has one customer whose revenue represents 14% (2022: 12%) of The Group’s total revenue and trade receivable - Forward contracts - 2 1 2
represents 30% (2022: 19%) of The Group's total trade receivables. - Interest rate swaps 18 - - 14
- Commodity swaps 4 123 974 -
(e) Other note Total designated derivatives 22 125 975 16
Segment revenue, results, assets and liabilities include the respective amounts identifiable to each of the segments and amounts Derivatives not designated in a hedge relationship
allocated on a reasonable basis.
- Forward contracts - 7 - 5
Total un-designated derivatives - 7 - 5
41.2 Discontinued operations Total current portion 22 132 975 21
(a) Information about operating segment
Non-current portion
` in crore
Year ended Year ended Derivatives designated in cash flow hedges
Particulars - Forward contracts - - - -
March 31, 2023 March 31, 2022
-
-
Result : - Interest rate swaps 2 23 3 -
6
-
- Commodity swaps
Segment result (note 36) - 28 Total designated derivatives 8 23 3 -
Share of loss of joint ventures (net of tax) (18) (10) Total non-current portion 8 23 3 -
(Loss)/profit before tax (18) 18 Total 30 155 978 21
Tax expenses - (13)
(Loss)/profit from discontinued operations after tax (18) 5 Derivatives not designated in a hedge relationship are effective as hedges from an economic perspective, however these are not
considered for hedge accounting.
344 345

