
Page 63 - Tata Chemical Annual Report_2022-2023
P. 63
Integrated Annual Report 2022-23 01-83 84-192 193-365
Integrated Report Statutory Reports Financial Statements
Environmental
Sustainability performance overview
Sustainability area Performance indicator FY 2022-23 FY 2021-22
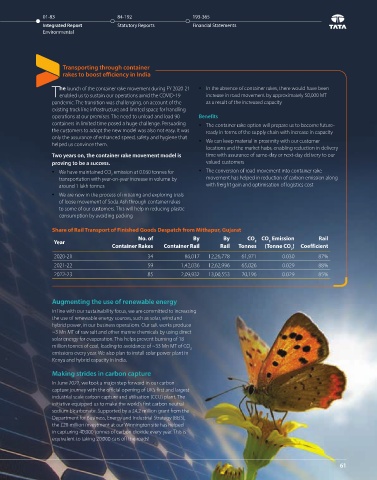
Scope 1 CO2 emissions (MT) 4,423,569 4,417,797 Transporting through container
Climate change rakes to boost efficiency in India
performance Scope 2 CO2 emissions (MT) 92,811 85,124
Scope 3 emissions (MT) 152,794 144,366
he launch of the container rake movement during FY 2020-21 In the absence of container rakes, there would have been
Energy Direct energy (TJ) 47,541 47,877 Tenabled us to sustain our operations amid the COVID-19 increase in road movement by approximately 50,000 MT
performance Indirect energy (TJ) 553 491 pandemic. The transition was challenging, on account of the as a result of the increased capacity
Fresh water (kilolitres) 34,305,876 32,053,227 existing track line infrastructure and limited space for handling
Water management Sea water (kilolitres) 72,411,893 68,935,625 operations at our premises. The need to unload and load 90 Benefits
containers in limited time posed a huge challenge. Persuading
Treated water discharged (kilolitres) 85,017,868 78,444,054 the customers to adopt the new model was also not easy. It was The container rake option will prepare us to become future-
ready in terms of the supply chain with increase in capacity
Hazardous waste (MT) 39,950 37,981 only the assurance of enhanced speed, safety and hygiene that
Waste generated helped us convince them. We can keep material in proximity with our customer
and disposed Non-hazardous waste (MT) 1,011,417 1,047,599 locations and the market hubs, enabling reduction in delivery
Solid waste utilisation - TCL India operation (MT) 580,601 570,561 Two years on, the container rake movement model is time with assurance of same-day or next-day delivery to our
Limestone (MT) 21,19,558 2,095,401 proving to be a success. valued customers
Raw material Trona (MT) 4,564,411 5,293,597
consumption We have maintained CO emission at 0.030 tonnes for The conversion of road movement into container rake
2
Solar Salt (MT) 2,543,352 2,599,410 transportation with year-on-year increase in volume by movement has helped in reduction of carbon emission along
Limestone recycled at India operations 525,006 570,561 around 1 lakh tonnes with freight gain and optimisation of logistics cost
Anthracite Breeze 6,646 5,886 We are now in the process of initiating and exploring trials
Recycled material Coke Breeze 2,576 2,665 of loose movement of Soda Ash through container rakes
consumed to some of our customers. This will help in reducing plastic
Pallets, packaging, pallet covers 7 11 consumption by avoiding packing
ESF Cake 42,003 36,712
Deca 234,416 221,623 Share of Rail Transport of Finished Goods Despatch from Mithapur, Gujarat
SOx (MT) 3,874 3,495 No. of By By CO CO Emission Rail
2
2
Air emissions NOx (MT) 5,450 4,345 Year Container Rakes Container Rail Rail Tonnes (Tonne CO ) Coefficient
2
SPM (MT) 2,083 3,094
2020-21 34 86,017 12,26,778 61,971 0.030 87%
FY2021-22 data revised with all subsidiaries including Rallis 2021-22 59 1,42,036 12,62,996 65,026 0.029 88%
For detailed information on sustainability performance, please refer to our website at https://sustainability.tatachemicals.com/
2022-23 85 2,09,932 13,00,553 70,196 0.029 85%
Shifting to low emission fuels In India, we have successfully conducted
trials for the use of biomass in our existing Optimising
Adoption of low emission fuels is boilers. We are actively exploring ways
critical to the achievement of our to establish a reliable supply chain, and process with VFD Augmenting the use of renewable energy
decarbonisation goals. ensure a consistent and resilient supply of in Kenya In line with our sustainability focus, we are committed to increasing
UK is leading our efforts of transitioning biomass for our operations in India rogressing on our the use of renewable energy sources, such as solar, wind and
to low emission fuels. We are Psustainability drive, we have hybrid power, in our business operations. Our salt works produce
realised energy savings to the tune
committed to replacing natural gas Enhancing energy efficiencies of around 1,33,590 Kwh through ~3 Mn MT of raw salt and other marine chemicals by using direct
with blue / green hydrogen. We have We have implemented energy efficiency process optimisation in our Kenya solar energy for evaporation. This helps prevent burning of 18
signed an offtake agreement with measures across our operations with the operations. We installed two million tonnes of coal, leading to avoidance of ~33 Mn MT of CO 2
Vertex Hydrogen for the supply of aim to reduce our energy consumption and Variable Frequency Drives (VFDs - emissions every year. We also plan to install solar power plant in
over 200 megawatts of low carbon lower our carbon emissions. Since 2014, of 30 Kw and 55 Kw motor ratings - Kenya and hybrid capacity in India.
hydrogen effective 2028 specific energy consumption of vacuum at the fan drives there during
salt (one of the key products in our India FY 2021-22. The drives were put Making strides in carbon capture
Our US operations consumed a mix of unit), has decreased from 6.44 GJ / tonne in for the calcination process, In June 2022, we took a major step forward in our carbon
coal and natural gas for thermal energy. to 4.29 GJ / tonne. In 2023, we undertook a enabling optimisation of speed and capture journey with the official opening of UK’s first and largest
We plan to gradually increase the share comprehensive energy audit and identified load. Two soft starters of 110 Kw industrial scale carbon capture and utilisation (CCU) plant. The
of natural gas over the next three to five several areas for improvement of energy were also installed at the dredge initiative equipped us to make the world’s first carbon neutral
years efficiency, including upgrading our equipment, pump stations. The soft starters use sodium bicarbonate. Supported by a £4.2 million grant from the
optimising our manufacturing processes, and internal circuitry to regulate voltage Department for Business, Energy and Industrial Strategy (BEIS),
The US operations has commissioned improving insulation. Additionally, we are supplied to the motor, ensuring a
the Dry Sorbent Injection (DSI) system, constantly evaluating new technologies, to slow and graceful start and the £20 million investment at our Winnington site has helped
resulting in SO2 emissions being below further optimise energy utilisation. drawing much less current. in capturing 40,000 tonnes of carbon dioxide every year. This is
the new Wyoming State requirements equivalent to taking 20,000 cars off the roads!
60 61