
Page 309 - Tata Chemical Annual Report_2022-2023
P. 309
Integrated Annual Report 2022-23 01-83 84-192 193-365
Integrated Report Statutory Reports Financial Statements
Consolidated
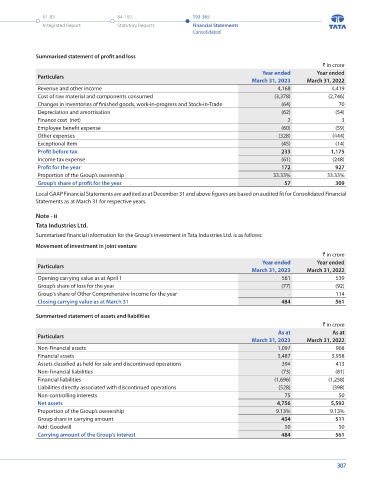
Summary of movement of investment in joint ventures Summarised statement of profit and loss
` in crore ` in crore
Year ended Year ended Year ended Year ended
Particulars Particulars
March 31, 2023 March 31, 2022 March 31, 2023 March 31, 2022
Opening carrying value as at April 1 A 1,234 952 Revenue and other income 4,168 4,419
Add: Share of profit/(loss) of joint ventures Cost of raw material and components consumed (3,378) (2,746)
Group’s share of profit/(loss) for the year (net of tax) Changes in inventories of finished goods, work-in-progress and Stock-in-Trade (64) 70
- from continuing operation (2) 226 Depreciation and amortisation (62) (54)
2
Finance cost (net)
3
- from discontinued operation ** (18) (10) Employee benefit expense (60) (59)
B (20) 216 Other expenses (328) (444)
Other Comprehensive Income (net of tax) C - 115 Exceptional Item (45) (14)
Dividend received during the year D (91) (27) Profit before tax 233 1,175
Exchange fluctuations E 13 (22) Income tax expense (61) (248)
Closing carrying value as at March 31 A to E 1,136 1,234 Profit for the year 172 927
Proportion of the Group’s ownership 33.33% 33.33%
** includes loss arising from Tata Industries Limited (a joint venture of the Group). Group’s share of profit for the year 57 309
Summarised financial information of joint ventures Local GAAP Financial Statements are audited as at December 31 and above figures are based on audited fit for Consolidated Financial
Statements as at March 31 for respective years.
Note - i
Indo Maroc Phosphore S.A. Note - ii
Summarised financial information for the Group's investment in Indo Maroc Phosphore S.A. is as follows: Tata Industries Ltd.
Summarised financial information for the Group's investment in Tata Industries Ltd. is as follows:
Movement of investment in joint venture
Year ended Year ended Movement of investment in joint venture
Particulars
March 31, 2023 March 31, 2022 ` in crore
Opening carrying value as at April 1 672 411 Particulars Year ended Year ended
Group’s share of profit for the year 57 309 March 31, 2023 March 31, 2022
Dividend received for the year (91) (27) Opening carrying value as at April 1 561 539
Exchange fluctuations 14 (21) Group’s share of loss for the year (77) - (92)
Group's share of Other Comprehensive Income for the year
114
Closing carrying value as at March 31 652 672
Closing carrying value as at March 31 484 561
Summarised statement of assets and liabilities
Summarised statement of assets and liabilities
` in crore ` in crore
As at As at
Particulars Particulars As at As at
March 31, 2023 March 31, 2022 March 31, 2023 March 31, 2022
Current assets 2,620 2,601 Non-Financial assets 1,097 908
Non-current assets 297 292 Financial assets 5,487 5,958
Current liabilities (1,256) (1,166) Assets classified as held for sale and discontinued operations 394 413
Non-current liabilities (48) (52) Non-Financial liabilities (73) (81)
Net assets 1,613 1,675 Financial liabilities (1,696) (1,258)
Proportion of the Group’s ownership 33.33% 33.33% Liabilities directly associated with discontinued operations (528) (398)
75
50
Group share in carrying amount 538 558 Non-controlling interests 4,756 5,592
Net assets
Add: Goodwill 114 114 Proportion of the Group’s ownership 9.13% 9.13%
Carrying amount of the Group's interest 652 672
Group share in carrying amount 434 511
Add: Goodwill 50 50
Carrying amount of the Group's interest 484 561
306 307