
Page 311 - Tata Chemical Annual Report_2022-2023
P. 311
Integrated Annual Report 2022-23 01-83 84-192 193-365
Integrated Report Statutory Reports Financial Statements
Consolidated
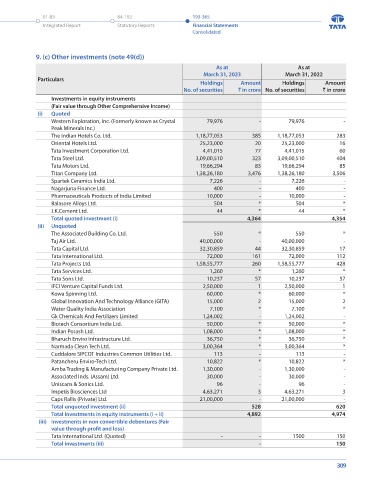
Summarised statement of profit and loss 9. (c) Other investments (note 49(d))
` in crore As at As at
Year ended Year ended March 31, 2023 March 31, 2022
Particulars
March 31, 2023 March 31, 2022 Particulars Holdings Amount Holdings Amount
Revenue and other income 338 258 No. of securities ` in crore No. of securities ` in crore
Finance cost (106) (69) Investments in equity instruments
Cost of raw material - (1) (Fair value through Other Comprehensive Income)
Purchase of stock-in-trade (45) (20) (i) Quoted
Changes in inventories of finished goods, work-in-progress and 2 - Western Exploration, Inc. (Formerly known as Crystal 79,976 - 79,976 -
Stock-in-Trade Peak Minerals Inc.)
Employee benefit expense (135) (141) The Indian Hotels Co. Ltd. 1,18,77,053 385 1,18,77,053 283
Depreciation and amortisation (30) (39) Oriental Hotels Ltd. 25,23,000 20 25,23,000 16
Other expenses (62) (163) Tata Investment Corporation Ltd. 4,41,015 77 4,41,015 60
Provision for impairment of investment in subsidiaries - (499) Tata Steel Ltd. 3,09,00,510 323 3,09,00,510 404
Share of loss from JV and associates (634) (263) Tata Motors Ltd. 19,66,294 83 19,66,294 85
Loss before tax (672) (937) Titan Company Ltd. 1,38,26,180 3,476 1,38,26,180 3,506
Income tax expense 2 - Spartek Ceramics India Ltd. 7,226 - 7,226 -
Loss for the year from Continuing operations (670) (937) Nagarjuna Finance Ltd. 400 - 400 -
Loss for the year from Dis-continued operations (192) (110) Pharmaceuticals Products of India Limited 10,000 - 10,000 -
Share of Non-controlling Interest 24 45 Balasore Alloys Ltd. 504 * 504 *
*
*
Loss for the year (838) (1,002) J.K.Cement Ltd. 44 4,364 44 4,354
Total quoted investment (i)
Proportion of the Group’s ownership 9.13% 9.13% (ii) Unquoted
Group’s share of loss for the year (77) (92)
The Associated Building Co. Ltd. 550 * 550 *
Note - iiii Taj Air Ltd. 40,00,000 - 40,00,000 -
Tata Capital Ltd. 32,30,859 44 32,30,859 17
The Block Salt Company Ltd.
Tata International Ltd. 72,000 161 72,000 112
Summarised financial information for the Group's investment in The Block Salt Company Ltd. is as follows: Tata Projects Ltd. 1,58,55,777 260 1,58,55,777 428
` in crore Tata Services Ltd. 1,260 * 1,260 *
Year ended Year ended Tata Sons Ltd. 10,237 57 10,237 57
Particulars
March 31, 2023 March 31, 2022 IFCI Venture Capital Funds Ltd. 2,50,000 1 2,50,000 1
Group share in carrying amount - 1 Kowa Spinning Ltd. 60,000 * 60,000 *
Group share of loss for the year - (1) Global Innovation And Technology Alliance (GITA) 15,000 2 15,000 2
Water Quality India Association 7,100 * 7,100 *
9. (b) Investments in associate (note 49(d)) Gk Chemicals And Fertilizers Limited 1,24,002 - 1,24,002 -
The Group’s interest in associate are accounted for using the equity method in the Consolidated Financial Statements. Biotech Consortium India Ltd. 50,000 * 50,000 *
Indian Potash Ltd. 1,08,000 * 1,08,000 *
Following are details of investments in associate: Bharuch Enviro Infrastructure Ltd. 36,750 * 36,750 *
Percentage of ownership Interest Narmada Clean Tech Ltd. 3,00,364 * 3,00,364 *
Particulars Country of incorporation As at As at Cuddalore SIPCOT Industries Common Utilities Ltd. 113 - 113 -
March 31, 2023 March 31, 2022 Patancheru Enviro-Tech Ltd. 10,822 * 10,822 *
JOil (S) Pte. Ltd. ('Joil') ^ Singapore 17.07% 17.07% Amba Trading & Manufacturing Company Private Ltd. 1,30,000 - 1,30,000 -
Associated Inds. (Assam) Ltd. 30,000 - 30,000 -
^During the previous year, consequent to the change in shareholder's agreement, investment in JOil (S) Pte. Ltd has been classified from Joint Venture to Associate.
Uniscans & Sonics Ltd. 96 - 96 -
Carrying amount of investment in associate Impetis Biosciences Ltd 4,63,271 3 4,63,271 3
` in crore Caps Rallis (Private) Ltd. 21,00,000 - 21,00,000 -
As at As at Total unquoted investment (ii) 528 620
Particulars Total Investments in equity instruments (i + ii) 4,892 4,974
March 31, 2023 March 31, 2022
JOil (S) Pte. Ltd.* - - (iii) Investments in non convertible debentures (Fair
value through profit and loss)
Total - -
Tata International Ltd. (Quoted) - - 1500 150
*The Group has impaired 100% investment during the year ended March 31, 2015. Total investments (iii) - 150
308 309