Page 304 - Tata Chemical Annual Report_2022-2023
P. 304

Integrated Annual Report 2022-23                01-83                   84-192                  193-365
                                                                                                                                     Integrated Report       Statutory Reports       Financial Statements
                                                                                                                                                                                     Consolidated


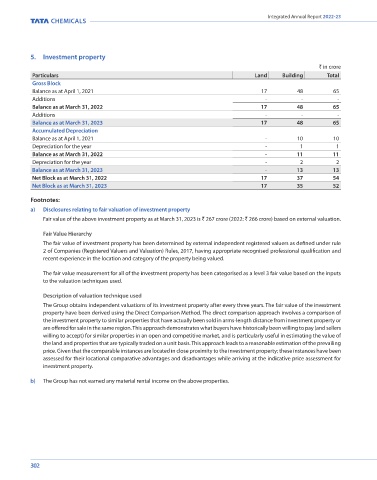
           5.  Investment property                                                                                                 6.  Right-of-use assets
                                                                                                      ` in crore                                                                                                              ` in crore
           Particulars                                                           Land     Building      Total                       Particulars                     Land Buildings   Plant and       Rail   Vehicles    Office   Total
           Gross Block                                                                                                                                                              Machinery  Equipment            Equipments
           Balance as at April 1, 2021                                              17         48          65                       Gross Block
           Additions                                                                 -          -          -                        Balance as at April 1, 2021       22      157         70         202       16           4     471
           Balance as at March 31, 2022                                             17         48          65                       Additions                          1       23          1          20         -          -      45
           Additions                                                                 -           -          -                       Disposals                         (1)      (30)       (1)         (52)     (3)          -     (87)
           Balance as at March 31, 2023                                             17         48          65                       Exchange fluctuations              1         -         1           6         -         1        9
           Accumulated Depreciation                                                                                                 Balance as at March 31, 2022      23      150         71         176       13          5      438
           Balance as at April 1, 2021                                               -         10          10                       Additions                          1       31          2          59        3          2       98
           Depreciation for the year                                                 -          1           1                       Disposals                         (3)      (25)       (2)         (10)     (10)       (4)     (54)
           Balance as at March 31, 2022                                              -         11          11                       Exchange fluctuations              1        5          2          17         -          -      25
           Depreciation for the year                                                 -          2           2                       Balance as at March 31, 2023      22      161         73         242        6          3      507
           Balance as at March 31, 2023                                              -         13          13                       Accumulated depreciation
           Net Block as at March 31, 2022                                           17         37          54                       Balance as at April 1, 2021        3       42         40         103       11          2      201
           Net Block as at March 31, 2023                                           17         35          52                       Amortisation for the year          1       28         14          51        4          1       99
                                                                                                                                    Disposals                           -      (25)       (1)         (52)     (3)          -     (81)
           Footnotes:                                                                                                               Exchange fluctuations               -        -          -          4         -          -       4
           a)   Disclosures relating to fair valuation of investment property                                                       Balance as at March 31, 2022       4       45         53         106       12          3      223
               Fair value of the above investment property as at March 31, 2023 is ` 267 crore (2022: ` 266 crore) based on external valuation.  Amortisation for the year  1   30        14          58        3          1      107
                                                                                                                                    Disposals                         (1)      (15)         -         (10)     (10)       (4)     (40)
               Fair Value Hierarchy                                                                                                 Exchange fluctuations               -       3          2          10         -          -      15
                The fair value of investment property has been determined by external independent registered valuers as defined under rule   Balance as at March 31, 2023  4   63         69         164        5           -     305
               2 of Companies (Registered Valuers and Valuation) Rules, 2017, having appropriate recognised professional qualification and   Net Block as at March 31, 2022  19   105     18          70        1          2      215
               recent experience in the location and category of the property being valued.                                         Net Block as at March 31, 2023    18       98          4          78        1          3      202
                                                                                                                                   Footnotes:
                The fair value measurement for all of the investment property has been categorised as a level 3 fair value based on the inputs   (Refer note 39 for lease liabilities related disclosures)
               to the valuation techniques used.
                                                                                                                                   7(a). Goodwill on consolidation
               Description of valuation technique used                                                                                                                                                                        ` in crore
                The Group obtains independent valuations of its investment property after every three years. The fair value of the investment   Particulars                                                  Year ended     Year ended
               property have been derived using the Direct Comparison Method. The direct comparison approach involves a comparison of                                                                     March 31, 2023  March 31, 2022
               the investment property to similar properties that have actually been sold in arms-length distance from investment property or   Carrying value as at April 1                                       1,971         1,917
               are offered for sale in the same region. This approach demonstrates what buyers have historically been willing to pay (and sellers   Exchange fluctuations                                           138            54
               willing to accept) for similar properties in an open and competitive market, and is particularly useful in estimating the value of   Carrying value as at March 31                                 2,109          1,971
               the land and properties that are typically traded on a unit basis. This approach leads to a reasonable estimation of the prevailing
               price. Given that the comparable instances are located in close proximity to the investment property; these instances have been   Goodwill of ` 1,719 crore (2022: ` 1,586 crore) and ` 238 crore (2022: ` 233 crore) relates to the CGUs - Tata Chemicals North America
               assessed for their locational comparative advantages and disadvantages while arriving at the indicative price assessment for   Inc. and it's subsidiaries ('TCNA Group') and Cheshire Salt Holdings Limited Group and it's subsidiaries ('CSHL Group') respectively.
               investment property.                                                                                                The estimated value in use of the CGUs are based on future cash flows assuming an terminal annual growth rate of 1% to 3.5% for
                                                                                                                                   the period subsequent to the forecast period of 5 years and discount rates in the range of 5% to 10%, which consider the operating
           b)   The Group has not earned any material rental income on the above properties.                                       and macro-economic environment in which the entities operate.

                                                                                                                                   An analysis of the sensitivity of the change in key parameters (operating margin, discount rates and long term average growth rate),
                                                                                                                                   based on probable assumptions, did not result in any probable scenario in which the recoverable amount of the CGUs would decrease
                                                                                                                                   below the carrying amount.

                                                                                                                                   Goodwill of ` 152 crore (2022: ` 152 crore) has been allocated to three CGUs (Individually immaterial) within the specialty products,
                                                                                                                                   and evaluated based on their recoverable amounts which exceeds their carrying amounts.


           302                                                                                                                                                                                                                    303
   299   300   301   302   303   304   305   306   307   308   309