
Page 248 - Tata_Chemicals_yearly-reports-2017-18
P. 248
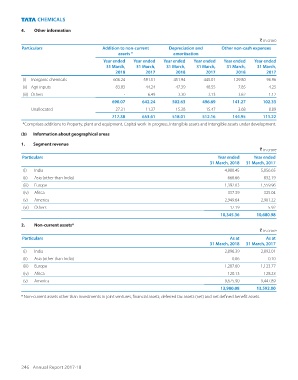
4.    Other information

                                                                                                         ` in crore
          Particulars                     Addition to non-current   Depreciation and     Other non-cash expenses
                                                assets *              amortisation
                                          Year ended   Year ended    Year ended    Year ended    Year ended    Year ended
                                           31 March,   31 March,   31 March,   31 March,   31 March,   31 March,
                                               2018        2017        2018        2017        2018        2017
           (i)  Inorganic chemicals            606.24      591.51      451.94      445.01      129.80       96.96
           (ii)  Agri inputs                    83.83       44.24       47.39       48.55        7.85        4.25
           (iii)  Others                           -         6.49        3.30        3.13        3.62        1.12
                                              690.07      642.24      502.63      496.69      141.27      102.33
             Unallocated                        27.31       11.37       15.38       15.47        3.68        8.89
                                              717.38      653.61      518.01      512.16      144.95      111.22
           *Comprises additions to Property, plant and equipment, Capital work-in-progress, Intangible assets and Intangible assets under development.

          (b)   Information about geographical areas
          1.  Segment revenue
                                                                                                         ` in crore
          Particulars                                                                   Year ended     Year ended
                                                                                     31 March, 2018   31 March, 2017
           (i)   India                                                                     4,980.45       5,056.65
           (ii)   Asia (other than India)                                                   668.66         832.19
           (iii)   Europe                                                                  1,392.03       1,559.96
           (iv)   Africa                                                                    337.39         325.04
           (v)   America                                                                   2,949.64       2,901.22
           (vi)   Others                                                                     17.19           5.92
                                                                                          10,345.36     10,680.98

          2.    Non-current assets*
                                                                                                         ` in crore
          Particulars                                                                        As at          As at
                                                                                     31 March, 2018   31 March, 2017
           (i)   India                                                                     2,896.39       2,892.01
           (ii)   Asia (other than India)                                                     0.06           0.10
           (iii)   Europe                                                                  1,287.60       1,123.77
           (iv)   Africa                                                                    120.13         128.23
           (v)   America                                                                   9,675.90       9,447.89
                                                                                          13,980.08     13,592.00
          * Non-current assets other than investments in joint ventures, financial assets, deferred tax assets (net) and net defined benefit assets.


          246  Annual Report 2017-18