
Page 253 - Tata_Chemicals_yearly-reports-2017-18
P. 253
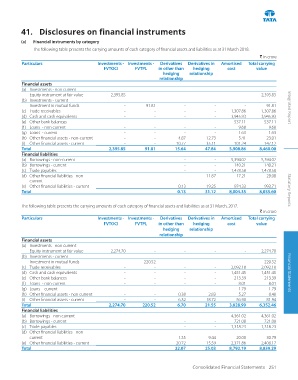
'LVFORVXUHV RQ ȴQDQFLDO LQVWUXPHQWV

          (a)   Financial instruments by category
              The following table presents the carrying amounts of each category of financial assets and liabilities as at 31 March 2018.
                                                                                                         ` in crore
          Particulars                   Investments -  Investments -   Derivatives   Derivatives in   Amortised   Total carrying
                                          FVTOCI       FVTPL    in other than   hedging     cost       value
                                                                  hedging    relationship
                                                                 relationship
          Financial assets
          (a) Investments - non current
             Equity instrument at fair value   2,395.85        -           -           -           -      2,395.85
          (b) Investments - current
             Investment in mutual funds            -        91.81          -           -           -        91.81   Integrated Report
          (c) Trade receivables                    -           -           -           -      1,307.86    1,307.86
          (d) Cash and cash equivalents            -           -           -           -      3,945.93    3,945.93
          (e) Other bank balances                  -           -           -           -       537.11      537.11
          (f) Loans  - non current                 -           -           -           -         9.68        9.68
          (g) Loans  - current                     -           -           -           -         1.63        1.63
          (h) Other financial assets - non-current   -          -         4.87       12.73        5.41       23.01
          (i)  Other financial assets - current     -           -        10.77       35.11      101.24      147.12
          Total                              2,395.85      91.81       15.64       47.84     5,908.86    8,460.00
          Financial liabilities
          (a) Borrowings - non-current                                     -           -      5,394.02    5,394.02
          (b) Borrowings - current                                         -           -       140.21      140.21
          (c) Trade payables                                               -           -      1,478.58    1,478.58
          (d) Other financial liabilities - non-                            -        11.87       17.21       29.08
             current
          (e) Other financial liabilities - current                       0.13       19.25      974.33      993.71
          Total                                                         0.13       31.12     8,004.35    8,035.60   Statutory Reports


          The following table presents the carrying amounts of each category of financial assets and liabilities as at 31 March, 2017.
                                                                                                         ` in crore
          Particulars                   Investments -  Investments -   Derivatives   Derivatives in   Amortised   Total carrying
                                          FVTOCI       FVTPL    in other than   hedging     cost       value
                                                                  hedging    relationship
                                                                 relationship
          Financial assets
          (a) Investments - non current
             Equity instrument at fair value   2,274.70        -           -           -           -      2,274.70
          (b) Investments - current
             Investment in mutual funds            -       220.52          -           -           -       220.52
          (c) Trade receivables                    -           -           -           -      2,092.18    2,092.18
          (d) Cash and cash equivalents            -           -           -           -      1,451.45    1,451.45   Financial Statements
          (e) Other bank balances                  -           -           -           -       213.39      213.39
          (f) Loans  - non current                 -           -           -           -         8.01        8.01
          (g) Loans  - current                     -           -           -           -         1.79        1.79
          (h) Other financial assets - non current   -          -         0.38        2.83        5.27        8.48
          (i)  Other financial assets - current     -           -         6.32       18.72       56.90       81.94
          Total                              2,274.70     220.52        6.70       21.55     3,828.99    6,352.46
          Financial liabilities
          (a) Borrowings - non current                                     -           -      4,361.02    4,361.02
          (b) Borrowings - current                                         -           -       721.08      721.08
          (c) Trade payables                                               -           -      1,318.23    1,318.23
          (d) Other financial liabilities - non
             current                                                     1.35        9.44       20.00       30.79
          (e) Other financial liabilities - current                      20.72       15.59     2,371.86    2,408.17
          Total                                                        22.07       25.03     8,792.19    8,839.29


                                                                              Consolidated Financial Statements 251