
Page 244 - Tata_Chemicals_yearly-reports-2017-18
P. 244
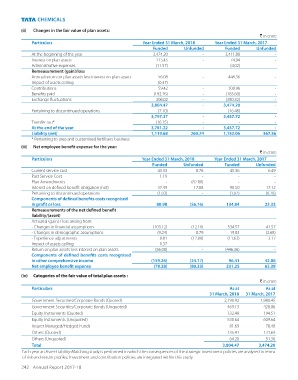
(ii)    Changes in the fair value of plan assets:
                                                                                                         ` in crore
              Particulars                                 Year Ended 31 March, 2018    Year Ended 31 March, 2017
                                                              Funded      Unfunded         Funded      Unfunded
              At the beginning of the year                     3,474.20           -        3,411.88            -
              Interest on plan assets                           113.45            -          74.94             -
              Administrative expenses                           (11.57)           -          (4.02)            -
              Remeasurement (gain)/loss
              Annual return on plan assets less interest on plan assets   56.08    -         446.36            -
              Impact of assets ceiling                           (0.37)           -              -             -
              Contributions                                      59.42            -          108.96            -
              Benefits paid                                     (192.76)           -         (183.60)           -
              Exchange fluctuations                              306.02            -         (380.32)           -
                                                              3,804.47            -        3,474.20            -
              Pertaining to discontinued operations              (7.10)           -          (16.48)           -
                                                              3,797.37            -        3,457.72            -
              Transfer out*                                     (16.15)           -              -             -
              At the end of the year                          3,781.22            -        3,457.72            -
              Liability (net)                                 1,119.68        269.24       1,152.06        367.56
              * Pertaining to urea and customised fertilisers business
          (iii)   Net employee benefit expense for the year:
                                                                                                         ` in crore
              Particulars                                 Year Ended 31 March, 2018   Year Ended 31 March, 2017
                                                              Funded      Unfunded         Funded      Unfunded
              Current service cost                              43.33           8.76         45.36           6.49
              Past Service Cost                                  1.19             -              -             -
              Plan Amendments                                       -         (82.80)            -             -
              Interest on defined benefit obligation (net)        37.49          17.88         90.50          17.12
              Pertaining to discontinued operations             (1.03)            -          (1.02)         (0.28)
              Components of defined benefits costs recognised
              in profit or loss                                 80.98        (56.16)        134.84         23.33
              Remeasurements of the net defined benefit
              liability/(asset)
              Actuarial (gain) / loss arising from:
              - Changes in financial assumptions                (103.12)       (12.16)       534.57          41.57
              - Changes in demographic assumptions              (9.24)          0.79         19.83          (2.68)
              - Experience adjustments                           8.81         (12.80)       (11.63)          3.17
              Impact of assets ceiling                           0.37             -              -             -
              Return on plan assets less interest on plan assets   (56.08)        -        (446.36)            -
              Components of defined benefits costs recognised
              in other comprehensive income                   (159.26)       (24.17)         96.41         42.06
              Net employee benefit expense                     (78.28)       (80.33)        231.25         65.39
          (iv)   Categories of the fair value of total plan assets :
                                                                                                         ` in crore
              Particulars                                                                    As at         As at
                                                                                     31 March, 2018  31 March, 2017
              Government Securities/Corporate Bonds (Quoted)                               2,190.92      1,980.45
              Government Securities/Corporate Bonds (Unquoted)                              469.13         428.06
              Equity Instruments (Quoted)                                                   332.48         194.51
              Equity Instruments (Unquoted)                                                 530.64         609.64
              Insurer Managed/Hedged Funds                                                   81.69          78.48
              Others (Quoted)                                                               135.41         131.69
              Others (Unquoted)                                                              64.20          51.36
              Total                                                                       3,804.47       3,474.20
          Each year an Asset-Liability-Matching study is performed in which the consequences of the strategic investment policies are analysed in terms
          of risk-and-return profiles. Investment and contribution policies are integrated within this study.
          242  Annual Report 2017-18