Page 247 - Tata_Chemicals_yearly-reports-2017-18
P. 247

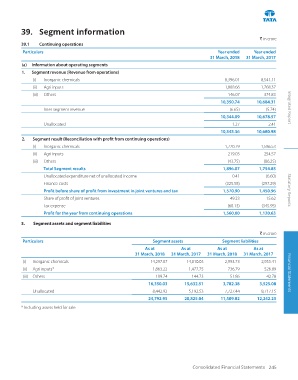
39. Segment information

                                                                                                         ` in crore
          39.1   Continuing operations
           Particulars                                                                  Year ended    Year ended
                                                                                     31 March, 2018  31 March, 2017
          (a)  Information about operating segments
          1.  Segment revenue (Revenue from operations)
               (i)    Inorganic chemicals                                                  8,396.01       8,541.11
               (ii)    Agri inputs                                                         1,808.66       1,768.37
               (iii)   Others                                                               146.07         374.83
                                                                                          10,350.74     10,684.31
                   Inter segment revenue                                                     (6.65)         (5.74)  Integrated Report
                                                                                          10,344.09     10,678.57
                   Unallocated                                                                1.27           2.41
                                                                                          10,345.36     10,680.98
          2.   Segment result (Reconciliation with profit from continuing operations)
               (i)    Inorganic chemicals                                                  1,720.79       1,586.53
               (ii)    Agri inputs                                                          219.03         254.57
               (iii)   Others                                                               (43.75)        (86.25)
                   Total Segment results                                                   1,896.07      1,754.85
                   Unallocated expenditure net of unallocated income                          0.41          (6.60)
                   Finance costs                                                            (325.58)      (297.29)
                   Profit before share of profit from investment in joint ventures and tax     1,570.90    1,450.96   Statutory Reports
                   Share of profit of joint ventures                                          49.23          15.62
                   Tax expense                                                              (60.13)       (345.95)
                   Profit for the year from continuing operations                          1,560.00      1,120.63
          3.   Segment assets and segment liabilities

                                                                                                         ` in crore
           Particulars                                        Segment assets              Segment liabilities
                                                           As at         As at          As at         As at
                                                       31 March, 2018  31 March, 2017  31 March, 2018  31 March, 2017
           (i)    Inorganic chemicals                         14,297.07     14,010.03      2,993.73       2,955.41
           (ii)   Agri inputs*                                1,863.22       1,477.75       736.79         526.89
           (iii)   Others                                       189.74        144.73         51.86          42.78   Financial Statements
                                                             16,350.03     15,632.51       3,782.38      3,525.08
               Unallocated                                    8,442.92       5,192.53      7,727.44       8,717.15
                                                             24,792.95     20,825.04      11,509.82     12,242.23
          * Including assets held for sale


                                                                              Consolidated Financial Statements 245
   242   243   244   245   246   247   248   249   250   251   252