
Page 245 - Tata_Chemicals_yearly-reports-2017-18
P. 245
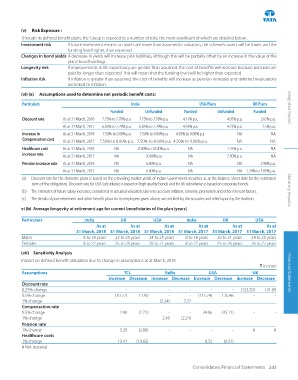
(v)  Risk Exposure :
          Through its defined benefit plans, the Group is exposed to a number of risks, the most significant of which are detailed below :
          Investment risk   If future investment returns on assets are lower than assumed in valuation, the scheme’s assets will be lower, and the
                            funding level higher, than expected.
          Changes in bond yields A decrease in yields will increase plan liabilities, although this will be partially offset by an increase in the value of the
                            plans’ bond holdings.
          Longevity risk    If improvements in life expectancy are greater than assumed, the cost of benefits will increase because pensions are
                            paid for longer than expected. This will mean that the funding level will be higher than expected.
          Inflation risk    If inflation is greater than assumed, the cost of benefits will increase as pension increases and deferred revaluations
                            are linked to inflation.
          (vi) (a)   Assumptions used to determine net periodic benefit costs:
          Particulars                                India                       USA Plans            UK Plans
                                             Funded        Unfunded       Funded        Unfunded      Funded        Integrated Report
          Discount rate   As at 31 March, 2018  7.75% to 7.78% p.a.  7.75% to 7.78% p.a.  4.11% p.a.  4.05% p.a.  2.65% p.a.
                          As at 31 March, 2017  6.85% to 7.29% p.a.  6.85% to 7.29% p.a.  4.29% p.a.  4.23% p.a.  2.5% p.a.
          Increase in     As at 31 March, 2018   7.50% to 8.00% p.a.    7.50% to 8.00% p.a.   4.50% to 9.00% p.a.  NA  NA
          Compensation cost
                          As at 31 March, 2017  7.50% to 8.00% p.a.   7.50% to 8.00% p.a.  4.50% to 9.00% p.a.  NA  NA
          Healthcare cost   As at 31 March, 2018  NA    8.00% to 10.00% p.a.  NA            7.25% p.a.       NA
          increase rate   As at 31 March, 2017  NA         10.00% p.a       NA              7.50% p.a.       NA
          Pension increase rate  As at 31 March, 2018  NA  6.00% p.a.       NA                  NA       2.90% p.a.
                          As at 31 March, 2017  NA         6.00% p.a.       NA                  NA 2.20% to 3.05% p.a.
          (a)  Discount rate for the domestic plans is based on the prevailing market yields of Indian Government securities as at the Balance Sheet date for the estimated
               term of the obligations. Discount rate for USA Subsidiaries is based on high quality bonds and for UK subsidiaries is based on corporate bonds.
          (b)  The estimates of future salary increases, considered in actuarial valuation, take into account inflation, seniority, promotion and other relevant factors.  Statutory Reports
          (c)  The details of post-retirement and other benefit plans for its employees given above, are certified by the actuaries and relied upon by the Auditors.

          vi (b)  Average longevity at retirement age for current beneficiaries of the plan (years)
          Particulars              India         UK           USA          India          UK           USA
                                       As at         As at         As at        As at         As at        As at
                               31 March, 2018 31 March, 2018 31 March, 2018 31 March, 2017 31 March, 2017 31 March, 2017
          Males                   8 to 18 years  22 to 25 years  24 to 25 years  8 to 18 years  20 to 21 years  24 to 25 years
          Females                 8 to 22 years  25 to 28 years  26 to 27 years  8 to 22 years  25 to 26 years  26 to 27 years
          (vii) Sensitivity Analysis
          Impact on defined benefit obligation due to change in assumptions as at March, 2018
                                                                                                         ` in crore
          Assumptions                             TCL              Rallis           USA               UK            Financial Statements
                                            Increase Decrease Increase Decrease Increase Decrease Increase Decrease
          Discount rate
          0.25% change                              -       -        -       -        -       -      (123.20)   131.09
          0.5% change                           (10.77)   11.90      -       -      (115.74)   135.46    -      -
          1% change                                 -       -      (3.24)  3.37       -       -        -       -
          Compensation rate
          0.5% change                            2.90    (2.72)      -       -      34.06    (35.11)   -       -
          1% change                                 -       -      2.48    (2.24)     -       -        -       -
          Pension rate
          1% change                              3.29    (2.86)      -       -        -       -       #        #
          Healthcare costs
          1% change                             13.41   (10.65)      -       -      0.33    (0.31)     -       -
          # Not material


                                                                              Consolidated Financial Statements 243