
Page 176 - Tata_Chemicals_yearly-reports-2017-18
P. 176
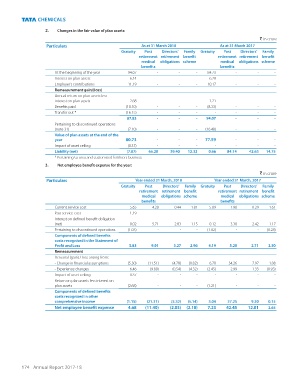
2.   Changes in the fair value of plan assets:
                                                                                                         ` in crore
                    Particulars                          As at 31 March 2018             As at 31 March 2017
                                                 Gratuity  Post   Directors’   Family   Gratuity  Post   Directors’   Family
                                                        retirement  retirement  benefit   retirement  retirement  benefit
                                                         medical   obligations scheme    medical  obligations scheme
                                                         benefits                        benefits
                       At the beginning of the year   94.07     -        -      -   84.73       -       -      -
                       Interest on plan assets       6.14       -        -      -   6.29        -       -      -
                       Employer’s contributions      11.19      -        -      -   10.17       -       -      -
                       Remeasurement gain/(loss)
                       Annual return on plan assets less
                       interest on plan assets       2.68       -        -      -   1.21        -       -      -
                       Benefits paid                (10.10)      -        -      -   (8.33)      -       -      -
                       Transfer out *              (16.15)      -        -      -      -        -       -      -
                                                    87.83       -        -      -   94.07       -       -      -
                       Pertaining to discontinued operations
                       (note 31)                     (7.10)     -        -      -    (16.48)    -       -      -
                       Value of plan assets at the end of the
                       year                         80.73       -        -      -    77.59     -        -      -
                       Impact of asset ceiling       (0.37)     -        -      -      -        -       -      -
                       Liability (net)              (7.07)  65.20    39.40   12.32   0.66   84.14   42.63   14.75
                       * Pertaining to urea and customised fertilisers business
                   3.   Net employee benefit expense for the year:
                                                                                                         ` in crore
                    Particulars                        Year ended 31 March, 2018      Year ended 31 March, 2017
                                                 Gratuity  Post   Directors’   Family  Gratuity  Post   Directors’   Family
                                                         retirement  retirement  benefit   retirement  retirement  benefit
                                                          medical   obligations scheme   medical  obligations scheme
                                                         benefits                        benefits
                       Current service cost          5.65     4.20     0.44    1.81    5.09    1.90    0.29    1.61
                       Past service cost             1.19       -        -      -      -        -       -      -
                       Interest on defined benefit obligation
                       (net)                         0.02     5.71     2.83    1.15    0.12    3.30    2.42    1.17
                       Pertaining to discontinued operations   (1.03)   -    -    -    (1.02)   -       -    (0.28)
                       Components of defined benefits
                       costs recognised in the Statement of
                       Profit and Loss               5.83     9.91     3.27    2.96    4.19    5.20    2.71    2.50
                       Remeasurement
                       Actuarial (gain) / loss arising from:
                       - Change in financial assumptions   (5.30)   (11.51)   (4.78)   (0.82)   6.70    34.26    7.97    1.08
                       - Experience changes          6.46     (9.80)   (0.54)   (4.32)   (2.45)   2.99    1.33    (0.93)
                       Impact of asset ceiling       0.37       -        -      -      -        -       -      -
                       Return on plan assets less interest on
                       plan assets                   (2.68)     -        -      -    (1.21)     -       -      -
                       Components of defined benefits
                       costs recognised in other
                       comprehensive income         (1.15)   (21.31)   (5.32)   (5.14)   3.04    37.25    9.30    0.15
                       Net employee benefit expense   4.68    (11.40)   (2.05)   (2.18)   7.23    42.45    12.01    2.65


          174 Annual Report 2017-18