
Page 177 - Tata_Chemicals_yearly-reports-2017-18
P. 177
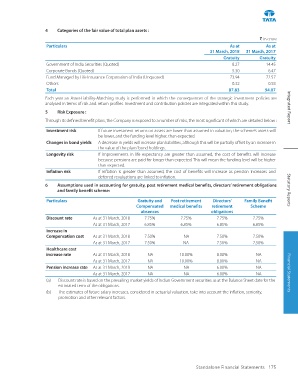
4    Categories of the fair value of total plan assets :
                                                                                                         ` in crore
                    Particulars                                                              As at         As at
                                                                                     31 March, 2018  31 March, 2017
                                                                                          Gratuity       Gratuity
                    Government of India Securities (Quoted)                                   8.27          14.45
                    Corporate Bonds (Quoted)                                                  5.30           6.47
                    Fund Managed by Life Insurance Corporation of India (Unquoted)           73.94          72.57
                    Others                                                                    0.32           0.58
                    Total                                                                    87.83         94.07
                   Each year an Asset-Liability-Matching study is performed in which the consequences of the strategic investment policies are
                   analysed in terms of risk-and-return profiles. Investment and contribution policies are integrated within this study.
                   5    Risk Exposure :                                                                             Integrated Report

                   Through its defined benefit plans, the Company is exposed to a number of risks, the most significant of which are detailed below :
                    Investment risk     If future investment returns on assets are lower than assumed in valuation, the scheme’s assets will
                                        be lower, and the funding level higher, than expected.
                    Changes in bond yields  A decrease in yields will increase plan liabilities, although this will be partially offset by an increase in
                                        the value of the plans’ bond holdings.
                    Longevity risk      If improvements in life expectancy are greater than assumed, the cost of benefits will increase
                                        because pensions are paid for longer than expected. This will mean the funding level will be higher
                                        than expected.
                    Inflation risk      If inflation is greater than assumed, the cost of benefits will increase as pension increases and
                                        deferred revaluations are linked to inflation.
                   6    Assumptions used in accounting for gratuity, post retirement medical benefits, directors’ retirement obligations
                        and family benefit scheme:                                                                  Statutory Reports

                    Particulars                         Gratuity and   Post retirement   Directors’   Family Benefit
                                                       Compensated   medical benefits  retirement    Scheme
                                                         absences                    obligations
                    Discount rate     As at 31 March, 2018  7.75%        7.75%         7.75%          7.75%
                                      As at 31 March, 2017  6.85%        6.85%         6.85%          6.85%
                    Increase in
                    Compensation cost  As at 31 March, 2018  7.50%         NA          7.50%          7.50%
                                      As at 31 March, 2017  7.50%         NA           7.50%          7.50%
                    Healthcare cost
                    increase rate     As at 31 March, 2018   NA          10.00%        8.00%            NA
                                      As at 31 March, 2017   NA          10.00%        8.00%            NA
                    Pension increase rate  As at 31 March, 2018   NA       NA          6.00%            NA
                                      As at 31 March, 2017   NA            NA          6.00%            NA          Financial Statements
                    (a)   Discount rate is based on the prevailing market yields of Indian Government securities as at the Balance Sheet date for the
                        estimated term of the obligations.
                    (b)   The estimates of future salary increases, considered in actuarial valuation, take into account the inflation, seniority,
                        promotion and other relevant factors.


                                                                               Standalone Financial Statements  175