
Page 239 - Tata_Chemicals_yearly-reports-2017-18
P. 239
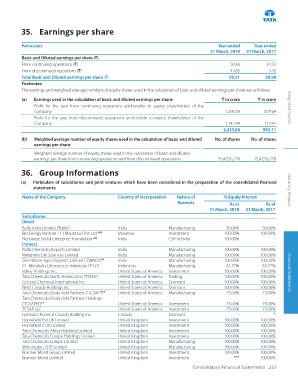
35.  Earnings per share


          Particulars                                                                   Year ended    Year ended
                                                                                     31 March, 2018  31 March, 2017
          Basic and Diluted earnings per share (`)
          From continuing operations (`)                                                     50.66          34.53
          From discontinued operations (`)                                                   44.85           4.45
          Total Basic and Diluted earnings per share (`)                                     95.51         38.98
          Footnotes:
          The earnings and weighted average numbers of equity shares used in the calculation of basic and diluted earnings per share are as follows.
          (a)  Earnings used in the calculation of basic and diluted earnings per share:  ` in crore    ` in crore
               Profit for the year from continuing operations attributable to equity shareholders of the             Integrated Report
               Company                                                                     1,290.59        879.64
               Profit for the year from discontinued operations attributable to equity shareholders of the
               Company                                                                     1,142.49        113.47
                                                                                           2,433.08       993.11
          (b)  Weighted average number of equity shares used in the calculation of basic and diluted   No. of shares  No. of shares
               earnings per share:
               Weighted average number of equity shares used in the calculation of basic and diluted
               earnings per share from continuing operations and from discontinued operations   25,47,56,278    25,47,56,278

          36. Group Informations

          (a)   Particulars of subsidiaries and joint ventures which have been considered in the preparation of the consolidated financial
              statements:                                                                                           Statutory Reports
          Name of the Company                   Country of Incorporation   Nature of      % Equity Interest
                                                                        Business             As at          As at
                                                                                     31 March, 2018  31 March, 2017
          Subsidiaries
          Direct
          Rallis India Limited (‘Rallis’)       India               Manufacturing          50.06%         50.06%
          Bio Energy Venture - 1 ( Mauritius) Pvt. Ltd  ###  Mauritius  Investment        100.00%        100.00%
          Ncourage Social Enterprise Foundation  @@  India          CSR Activity          100.00%             -
          Indirect
          Rallis Chemistry Exports Limited      India               Manufacturing         100.00%        100.00%
          Metahelix Life Sciences Limited       India               Manufacturing         100.00%        100.00%
          Zero Waste Agro Organics Limited (‘ZWAOL’) ##  India      Manufacturing         100.00%        100.00%
          PT  Metahelix Lifesciences Indonesia (‘PTLI’)  Indonesia  Manufacturing          65.77%         65.77%
          Valley Holdings Inc.                  United States of America  Investment      100.00%        100.00%    Financial Statements
          Tata Chemicals North America Inc.(‘TCNA’)  United States of America  Trading    100.00%        100.00%
          General Chemical International Inc.   United States of America  Dormant         100.00%        100.00%
          NHO Canada Holdings Inc.              United States of America  Dormant         100.00%        100.00%
          Tata Chemicals (Soda Ash) Partners (‘TCSAP’)**  United States of America  Manufacturing   75.00%  75.00%
          Tata Chemicals (Soda Ash) Partners Holdings
          (‘TCSAPH’)**                          United States of America  Investment       75.00%         75.00%
          TCSAP LLC                             United States of America  Investment       75.00%         75.00%
          General Chemical Canada Holding Inc.  Canada              Dormant                     -             *
          Homefield Pvt UK Limited               United Kingdom      Investment            100.00%        100.00%
          Homefield 2 UK Limited                 United Kingdom      Investment            100.00%        100.00%
          Tata Chemicals Africa Holdings Limited  United Kingdom    Investment            100.00%        100.00%
          Tata Chemicals Europe Holdings Limited  United Kingdom    Investment            100.00%        100.00%
          Tata Chemicals Europe Limited         United Kingdom      Manufacturing         100.00%        100.00%
          Winnington CHP Limited                United Kingdom      Manufacturing         100.00%        100.00%
          Brunner Mond Group Limited            United Kingdom      Investment            100.00%        100.00%
          Brunner Mond Limited                  United Kingdom      Investment                ***        100.00%
                                                                              Consolidated Financial Statements 237