Page 156 - Tata Chemical Annual Report_2022-2023
P. 156

Integrated Annual Report 2022-23                01-83                   84-192                  193-365
                                                                                                                                     Integrated Report       Statutory Reports       Financial Statements
                                                                                                                                                             Management Discussion
                                                                                                                                                             & Analysis

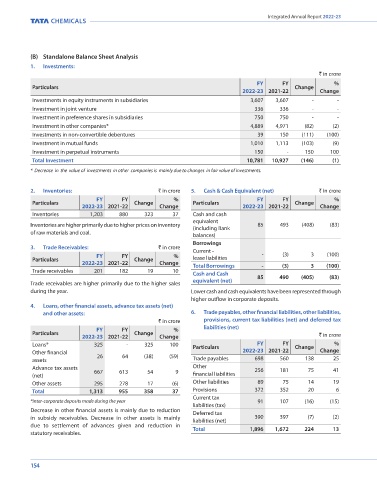
           (B)  Standalone Balance Sheet Analysis                                                                                  Increase in trade payables is mainly due to higher cost of   ii.   Cost of materials consumed   ` in crore
           1.  Investments:                                                                                                        raw materials reflected through an overall increase in the              FY      FY              %
                                                                                                      ` in crore                   cost base.                                         Entity          2022-23 2021-22  Change  Change
                                                                                  FY      FY              %                        (C)  Standalone Cash flow analysis                 TCL, India        1,138     814     324      40
           Particulars                                                                        Change
                                                                             2022-23 2021-22          Change
                                                                                                                                                                           ` in crore  TCE Group, UK      246     181      65      36
           Investments in equity instruments in subsidiaries                    3,607   3,607      -       -                                                            FY      FY
           Investment in joint venture                                           336     336       -       -                        Particulars                    2022-23 2021-22    Rallis, India     1,592   1,448     144      10
           Investment in preference shares in subsidiaries                       750     750       -       -                        Cash from operating activities     885     582    Others and          (29)    (19)    (10)     53
           Investment in other companies*                                       4,889   4,971    (82)     (2)                       Cash from investing activities    (558)   (355)   Eliminations
           Investments in non-convertible debentures                              39     150    (111)   (100)                       Cash from financing activities    (332)   (270)   Total             2,947   2,424     523     22
           Investment in mutual funds                                           1,010   1,113   (103)     (9)                      Net cash flow from operating activities: Higher operating cash
           Investment in perpetual instruments                                   150       -     150     100                       flow in FY 2022-23 against FY 2021-22 is mainly on account of   The increase in cost of materials reflects higher raw material
                                                                                                                                                                                      costs across units. In case of TCNA and TCML, raw materials are
           Total Investment                                                    10,781  10,927   (146)     (1)                      change in working capital.                         primarily mined and do not involve external purchases and are
           *  Decrease  in  the  value of  investments  in other  companies is  mainly due to changes  in fair value of investments.  Net cash flow from investing activities: Higher investing cash   hence not reflected in cost of materials consumed.
                                                                                                                                   outflow in FY 2022-23 is mainly on account of redemption of
           2.  Inventories:                        ` in crore  5.   Cash & Cash Equivalent (net)      ` in crore                   current investments compensated by higher purchase of property,   iii.  Purchases of stock-in-trade   ` in crore
                               FY      FY               %                         FY      FY              %                        plant and equipment (including capital work-in-progress).  Entity       FY      FY   Change     %
           Particulars                     Change             Particulars                     Change                                                                                                  2022-23 2021-22         Change
                           2022-23 2021-22         Change                    2022-23 2021-22          Change                       Net cash flow from financing activities: Higher cash outflow in
           Inventories       1,203     880     323     37     Cash and cash                                                        FY 2022-23 is mainly on account of dividend paid.  TCL, India          130     160     (30)    (19)
                                                              equivalent
           Inventories are higher primarily due to higher prices on inventory   (including Bank   85         493  (408)  (83)      (D)   Details of significant changes in key Standalone   TCNA, USA      26      24       2      8
           of raw materials and coal.                         balances)                                                                financial ratios:                              Rallis, India       158     120      38      32
                                                              Borrowings                                                                                                              Others and
           3.   Trade Receivables:                 ` in crore  Current -                                                                 Debt Equity Ratio (times) of the Company has improved             50      32      18      56
                               FY      FY               %                           -     (3)      3    (100)                          due to increase in equity (on account of profits earned   Eliminations
           Particulars                     Change             lease liabilities
                           2022-23 2021-22         Change     Total Borrowings     -      (3)      3    (100)                          during the year), while debt continued to remain almost   Total    364     336     28       8
           Trade receivables   201     182     19      10     Cash and Cash                                                            negligible during the year.
                                                              equivalent (net)    85     490    (405)    (83)                                                                         iv.   Power and fuel                    ` in crore
           Trade receivables are higher primarily due to the higher sales                                                          (E)   Consolidated performance for the year ended
           during the year.                                  Lower cash and cash equivalents have been represented through             March 31, 2023:                                                     FY      FY              %
                                                             higher outflow in corporate deposits.                                 i.   Revenue from operations            ` in crore  Entity         2022-23 2021-22  Change  Change
           4.     Loans, other financial assets, advance tax assets (net)                                                                               FY      FY              %     TCL, India        1,188     670     518      77
               and other assets:                             6.    Trade payables, other financial liabilities, other liabilities,   Entity        2022-23 2021-22  Change  Change
                                                   ` in crore    provisions, current tax liabilities (net) and deferred tax         Tata Chemicals                                    TCNA, USA           610     392     218      56
                               FY      FY               %        liabilities (net)                                                  Limited           4,930   3,721   1,209     32    TCE Group, UK       960     878      82      9
           Particulars                     Change                                                     ` in crore                    (‘TCL’), India
                           2022-23 2021-22         Change                                                                                                                             TCML, Kenya         136     103      33      32
           Loans*              325       -     325    100     Particulars         FY      FY   Change     %                         Tata Chemicals
           Other financial      26      64    (38)    (59)                   2022-23 2021-22          Change                        North America Inc.   5,271  3,688  1,583    43    Rallis, India        94      69      25      36
                                                                                                                                    (‘TCNA’), USA
           assets                                             Trade payables     698     560     138      25                        TCE Group Limited                                 Total             2,988   2,112     876     41
           Advance tax assets   667    613     54       9     Other              256     181      75      41                        - Consolidated    2,629   1,949    680      35    Power and fuel costs have increased on account of higher coal
           (net)                                              financial liabilities                                                 (‘TCE Group’), UK                                 and gas prices across units.
           Other assets        295     278     17      (6)    Other liabilities   89      75      14      19                        Tata Chemicals
           Total             1,313    955     358      37     Provisions         372     352      20       6                        Magadi Limited     945     577     368      64
                                                              Current tax                                                           (‘TCML’), Kenya
           *inter-corporate deposits made during the year                         91     107     (16)    (15)                       Rallis India Limited
                                                              liabilities (tax)                                                                       2,967   2,602    365      14
           Decrease in other financial assets is mainly due to reduction   Deferred tax                                             (‘Rallis’), India
           in subsidy receivables. Decrease in other assets is mainly   liabilities (net)  390   397   (7)   (2)                    Others and          47      85     (38)    (45)
           due to settlement of advances given and reduction in   Total         1,896   1,672    224      13                        Eliminations
           statutory receivables.                                                                                                   Total            16,789  12,622   4,167     33
                                                                                                                                   Higher realisation for soda ash across geographies compared to
                                                                                                                                   previous year.


           154                                                                                                                                                                                                                    155
   151   152   153   154   155   156   157   158   159   160   161