
Page 335 - Tata_Chemicals_yearly-reports-2021-22
P. 335
01 INTEGRATED 73 STATUTORY 178 FINANCIAL
REPORTS
STATEMENTS
REPORT
Consolidated
The Risk Management Policy includes an appropriate liquidity risk management framework for the management of the Group’s
short-term, medium-term and long term funding and liquidity management requirements. The Group manages the liquidity risk by
maintaining adequate reserves, banking facilities and reserve borrowing facilities, by continuously monitoring forecast and actual
cash flows, and by matching the maturity profiles of financial assets and liabilities. The Group invests its surplus funds in bank fixed
deposit and liquid schemes of mutual funds, which carry no/negligible mark to market risks.
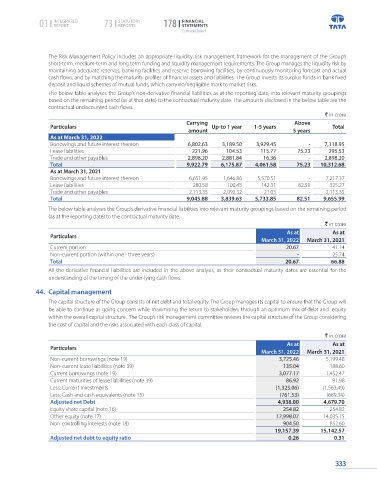
The below table analyses the Group’s non-derivative financial liabilities as at the reporting date, into relevant maturity groupings
based on the remaining period (as at that date) to the contractual maturity date. The amounts disclosed in the below table are the
contractual undiscounted cash flows.
` in crore
Carrying Above
Particulars Up-to 1 year 1-5 years Total
amount 5 years
As at March 31, 2022
Borrowings and future interest thereon 6,802.63 3,189.50 3,929.45 - 7,118.95
Lease liabilities 221.96 104.53 115.77 75.23 295.53
Trade and other payables 2,898.20 2,881.84 16.36 - 2,898.20
Total 9,922.79 6,175.87 4,061.58 75.23 10,312.68
As at March 31, 2021
Borrowings and future interest thereon 6,651.95 1,646.86 5,570.51 - 7,217.37
Lease liabilities 280.58 100.45 142.31 82.51 325.27
Trade and other payables 2,113.35 2,092.32 21.03 - 2,113.35
Total 9,045.88 3,839.63 5,733.85 82.51 9,655.99
The below table analyses the Group’s derivative financial liabilities into relevant maturity groupings based on the remaining period
(as at the reporting date) to the contractual maturity date.
` in crore
As at As at
Particulars
March 31, 2022 March 31, 2021
Current portion 20.67 41.14
Non-current portion (within one - three years) - 25.74
Total 20.67 66.88
All the derivative financial liabilities are included in the above analysis, as their contractual maturity dates are essential for the
understanding of the timing of the under-lying cash flows.
44. Capital management
The capital structure of the Group consists of net debt and total equity. The Group manages its capital to ensure that the Group will
be able to continue as going concern while maximising the return to stakeholders through an optimum mix of debt and equity
within the overall capital structure. The Group’s risk management committee reviews the capital structure of the Group considering
the cost of capital and the risks associated with each class of capital.
` in crore
As at As at
Particulars
March 31, 2022 March 31, 2021
Non-current borrowings (note 19) 3,725.46 5,199.48
Non-current lease liabilities (note 39) 135.04 188.60
Current borrowings (note 19) 3,077.17 1,452.47
Current maturities of lease liabilities (note 39) 86.92 91.98
Less: Current Investments (1,325.06) (1,563.49)
Less: Cash and cash equivalents (note 15) (761.53) (689.34)
Adjusted net Debt 4,938.00 4,679.70
Equity share capital (note 16) 254.82 254.82
Other equity (note 17) 17,998.07 14,035.15
Non-controlling interests (note 18) 904.50 852.60
19,157.39 15,142.57
Adjusted net debt to equity ratio 0.26 0.31
333