
Page 326 - Tata_Chemicals_yearly-reports-2021-22
P. 326
Integrated Annual Report 2021-22
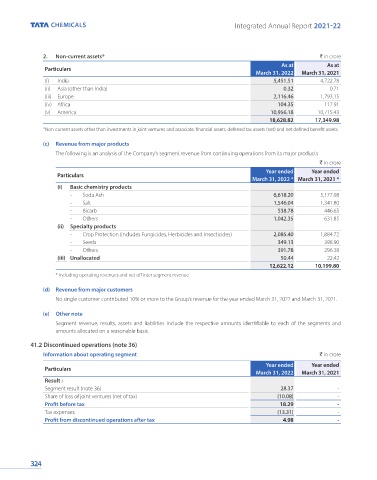
2. Non-current assets* ` in crore
As at As at
Particulars
March 31, 2022 March 31, 2021
(i) India 5,451.51 4,722.78
(ii) Asia (other than India) 0.32 0.71
(iii) Europe 2,116.46 1,793.15
(iv) Africa 104.35 117.91
(v) America 10,956.18 10,715.43
18,628.82 17,349.98
*Non-current assets other than investments in joint ventures and associate, financial assets, deferred tax assets (net) and net defined benefit assets
(c) Revenue from major products
The following is an analysis of the Company's segment revenue from continuing operations from its major products
` in crore
Year ended Year ended
Particulars
March 31, 2022 * March 31, 2021 *
(i) Basic chemistry products
- Soda Ash 6,618.20 5,177.08
- Salt 1,546.04 1,341.80
- Bicarb 538.78 446.65
- Others 1,042.35 631.85
(ii) Specialty products
- Crop Protection (includes Fungicides, Herbicides and Insecticides) 2,085.40 1,884.72
- Seeds 349.13 398.90
- Others 391.78 296.38
(iii) Unallocated 50.44 22.42
12,622.12 10,199.80
* Including operating revenues and net off inter segment revenue
(d) Revenue from major customers
No single customer contributed 10% or more to the Group’s revenue for the year ended March 31, 2022 and March 31, 2021.
(e) Other note
Segment revenue, results, assets and liabilities include the respective amounts identifiable to each of the segments and
amounts allocated on a reasonable basis.
41.2 Discontinued operations (note 36)
Information about operating segment ` in crore
Year ended Year ended
Particulars
March 31, 2022 March 31, 2021
Result :
Segment result (note 36) 28.37 -
Share of loss of joint ventures (net of tax) (10.08) -
Profit before tax 18.29 -
Tax expenses (13.31) -
Profit from discontinued operations after tax 4.98 -
324