
Page 237 - Tata_Chemicals_yearly-reports-2017-18
P. 237
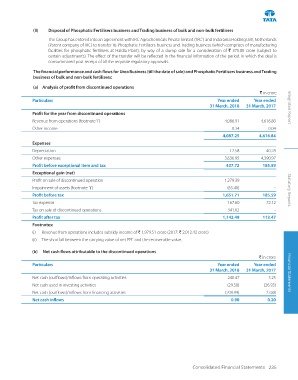
(II)   Disposal of Phosphatic Fertilisers business and Trading business of bulk and non-bulk fertilisers
                    The Group has entered into an agreement with IRC Agrochemicals Private limited (‘IRC’) and Indorama Holdings BV, Netherlands
                    (Parent company of IRC) to transfer its Phosphatic Fertilisers business and Trading business (which comprises of manufacturing
                    facilities for phosphatic fertilisers at Haldia Plant), by way of a slump sale for a consideration of  ` 375.00 crore (subject to
                    certain adjustments). The effect of the transfer will be reflected in the financial information of the period in which the deal is
                    consummated post receipt of all the requisite regulatory approvals.
              The financial performance and cash flows for Urea Business (till the date of sale) and Phosphatic Fertilisers business and Trading
              business of bulk and non-bulk fertilisers:
              (a)  Analysis of profit from discontinued operations
                                                                                                         ` in crore
              Particulars                                                               Year ended    Year ended
                                                                                     31 March, 2018  31 March, 2017  Integrated Report
              Profit for the year from discontinued operations
              Revenue from operations (footnote ‘i’)                                       4,086.91       4,616.80
              Other income                                                                    0.34           0.04
                                                                                          4,087.25       4,616.84
              Expenses
              Depreciation                                                                   12.58          40.28
              Other expenses                                                               3,636.95       4,390.97
              Profit before exceptional item and tax                                        437.72        185.59
              Exceptional gain (net)
              Profit on sale of discontinued operation                                      1,279.39            -
              Impairment of assets (footnote 'ii')                                          (65.40)            -     Statutory Reports
              Profit before tax                                                           1,651.71        185.59
              Tax expense                                                                   167.60          72.12
              Tax on sale of discontinued operations                                        341.62             -
              Profit after tax                                                            1,142.49        113.47
              Footnotes:
              (i)  Revenue from operations includes subsidy income of ` 1,979.51 crore (2017: ` 2,012.42 crore)
              (ii)  The shortfall between the carrying value of net PPE and the recoverable value.

              (b)   Net cash flows attributable to the discontinued operations
                                                                                                        ` in crore
              Particulars                                                               Year ended    Year ended
                                                                                     31 March, 2018  31 March, 2017  Financial Statements
              Net cash (outflows)/inflows from operating activities                           240.47           3.25
              Net cash used in investing activities                                         (29.58)        (26.93)
              Net cash (outflows)/inflows from financing activities                           (209.99)         23.88
              Net cash inflows                                                                0.90          0.20


                                                                              Consolidated Financial Statements 235