Page 183 - Tata_Chemicals_yearly-reports-2017-18
P. 183

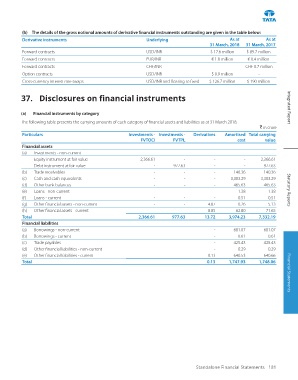
(b) The details of the gross notional amounts of derivative financial instruments outstanding are given in the table below:
          Derivative instruments                           Underlying                        As at          As at
                                                                                     31 March, 2018  31 March, 2017
          Forward contracts                                USD/INR                   $ 17.6 million  $ 89.7 million
          Forward contracts                                EUR/INR                   € 1.8 million   € 0.4 million
          Forward contracts                                CHF/INR                        -         CHF 0.7 million
          Option contracts                                 USD/INR                   $ 0.9 million       -
          Cross-currency interest rate swaps               USD/INR and floating to fixed  $ 126.7 million  $ 190 million


               'LVFORVXUHV RQ ȴQDQFLDO LQVWUXPHQWV
                                                                                                                    Integrated Report
          (a)   Financial instruments by category
          The following table presents the carrying amounts of each category of financial assets and liabilities as at 31 March 2018.
                                                                                                         ` in crore
           Particulars                              Investments -  Investments -   Derivatives  Amortised  Total carrying
                                                         FVTOCI       FVTPL                     cost       value
          Financial assets
          (a)  Investments - non-current
               Equity instrument at fair value            2,366.61         -           -           -      2,366.61
               Debt instrument at fair value                   -       977.63          -           -       977.63
          (b)  Trade receivables                               -           -           -       140.36      140.36
          (c)  Cash and cash equivalents                       -           -           -      3,303.29    3,303.29
          (d)  Other bank balances                             -           -           -       465.63      465.63
          (e)  Loans - non-current                             -           -           -         1.38        1.38   Statutory Reports
          (f)  Loans - current                                 -           -           -         0.51        0.51
          (g)  Other financial assets - non-current             -           -         4.87        0.26        5.13
          (h)  Other financial assets - current                 -           -         8.85       62.80       71.65
          Total                                          2,366.61     977.63       13.72     3,974.23    7,332.19
          Financial liabilities
          (a)  Borrowings - non-current                                                -       681.07      681.07
          (b)  Borrowings - current                                                    -         0.61        0.61
          (c)  Trade payables                                                          -       425.43      425.43
          (d)  Other financial liabilities - non-current                                -         0.29        0.29
          (e)  Other financial liabilities - current                                  0.13      640.53      640.66
          Total                                                                     0.13     1,747.93    1,748.06   Financial Statements


                                                                               Standalone Financial Statements  181
   178   179   180   181   182   183   184   185   186   187   188