
Page 184 - Tata_Chemicals_yearly-reports-2017-18
P. 184
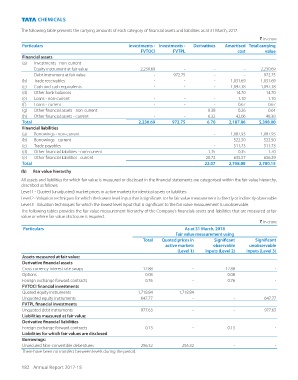
The following table presents the carrying amounts of each category of financial assets and liabilities as at 31 March, 2017.
                                                                                                         ` in crore
           Particulars                              Investments -  Investments -   Derivatives  Amortised Total carrying
                                                         FVTOCI       FVTPL                     cost       value
          Financial assets
          (a)  Investments - non-current
               Equity instrument at fair value            2,230.69         -           -           -      2,230.69
               Debt instrument at fair value                   -       972.75          -           -       972.75
          (b)  Trade receivables                               -           -           -      1,031.69    1,031.69
          (c)  Cash and cash equivalents                       -           -           -      1,097.38    1,097.38
          (d)  Other bank balances                             -           -           -        14.70       14.70
          (e)  Loans - non-current                             -           -           -         1.10        1.10
          (f)  Loans - current                                 -           -           -         0.67        0.67
          (g)  Other financial assets - non-current             -           -         0.38        0.26        0.64
          (h)  Other financial assets - current                 -           -         6.32       42.06       48.38
          Total                                          2,230.69     972.75        6.70     2,187.86    5,398.00
          Financial liabilities
          (a)  Borrowings - non-current                                                -      1,087.93    1,087.93
          (b)  Borrowings - current                                                    -       522.50      522.50
          (c)  Trade payables                                                          -       511.73      511.73
          (d)  Other financial liabilities - non-current                              1.35        0.35        1.70
          (e)  Other financial liabilities - current                                 20.72      635.57      656.29
          Total                                                                    22.07     2,758.08    2,780.15
          (b)   Fair value hierarchy
          All assets and liabilities for which fair value is measured or disclosed in the financial statements are categorised within the fair value hierarchy,
          described as follows:
          Level 1 - Quoted (unadjusted) market prices in active markets for identical assets or liabilities
          Level 2 - Valuation techniques for which the lowest level input that is significant to the fair value measurement is directly or indirectly observable
          Level 3 - Valuation techniques for which the lowest level input that is significant to the fair value measurement is unobservable.
          The following tables provides the fair value measurement hierarchy of the Company’s financials assets and liabilities that are measured at fair
          value or where fair value disclosure is required.
                                                                                                         ` in crore
           Particulars                                                     As at 31 March, 2018
                                                                       Fair value measurement using
                                                          Total   Quoted prices in    Significant      Significant
                                                                   active markets     observable    unobservable
                                                                        (Level 1)  inputs (Level 2)  inputs (Level 3)
          Assets measured at fair value:
          Derivative financial assets
          Cross currency interest rate swaps               12.88              -            12.88               -
          Options                                           0.08              -             0.08               -
          Foreign exchange forward contracts                0.76              -             0.76               -
          FVTOCI financial investments
          Quoted equity instruments                      1,718.84        1,718.84              -               -
          Unquoted equity instruments                     647.77              -                -           647.77
          FVTPL financial investments
          Unquoted debt instruments                       977.63              -                -           977.63
          Liabilities measured at fair value:
          Derivative financial liabilities
          Foreign exchange forward contracts                0.13              -             0.13               -
          Liabilities for which fair values are disclosed
          Borrowings:
          Unsecured Non-convertible debentures            256.32          256.32               -               -
          There have been no transfers between levels during the period.

          182 Annual Report 2017-18