
Page 163 - Tata_Chemicals_yearly-reports-2017-18
P. 163
` in crore
Particulars Year ended Year ended
31 March, 2018 31 March, 2017
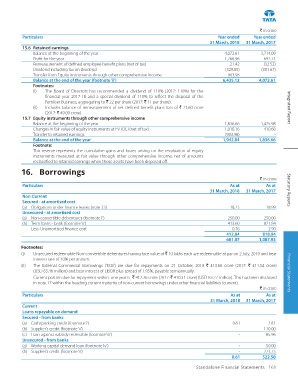
15.6 Retained earnings
Balance at the beginning of the year 4,072.61 3,714.09
Profit for the year 1,766.96 692.71
Remeasurement of defined employee benefit plans (net of tax) 21.42 (32.52)
Dividend including tax on dividend (329.85) (301.67)
Transfer from Equity instruments through other comprehensive income 903.98 -
Balance at the end of the year (footnote ‘ii’) 6,435.12 4,072.61
Footnotes:
(i) The Board of Directors has recommended a dividend of 110% (2017: 110%) for the
financial year 2017-18 and a special dividend of 110% to reflect the disposal of the
Fertiliser Business, aggregating to ` 22 per share (2017: ` 11 per share).
(ii) Includes balance of remeasurement of net defined benefit plans loss of ` 23.60 crore Integrated Report
(2017: ` 49.09 crore).
15.7 Equity instruments through other comprehensive income
Balance at the beginning of the year 1,836.66 1,425.98
Changes in fair value of equity instruments at FVTOCI (net of tax) 1,010.16 410.68
Transfer to retained earnings (903.98) -
Balance at the end of the year 1,942.84 1,836.66
Footnote:
This reserve represents the cumulative gains and losses arising on the revaluation of equity
instruments measured at fair value through other comprehensive income, net of amounts
reclassified to retained earnings when those assets have been disposed off.
16. Borrowings
` in crore
Particulars As at As at
31 March, 2018 31 March, 2017 Statutory Reports
Non-Current
Secured - at amortised cost
(a) Obligations under finance leases (note 33) 18.23 18.99
Unsecured - at amortised cost
(a) Non-convertible debentures (footnote ‘i’) 250.00 250.00
(b) Term loans - bank (footnote ‘ii’) 413.60 821.84
Less: Unamortised finance cost 0.76 2.90
412.84 818.94
681.07 1,087.93
Footnotes:
(i) Unsecured redeemable Non-convertible debentures having face value of ` 10 lakhs each are redeemable at par on 2 July, 2019 and bear
interest rate of 10% per annum.
(ii) The External Commercial Borrowings (‘ECB’) are due for repayments on 21 October, 2019 ` 413.60 crore (2017: ` 411.54 crore)
(USD 63.46 million) and bear interest of LIBOR plus spread of 1.95%, payable semiannually. Financial Statements
Current portion due for repayment within one year is ` 412.36 crore (2017: ` 410.31 crore) (USD 63.27 million). This has been disclosed
in note 17 within the heading current maturity of non-current borrowings under other financial liabilities (current).
` in crore
Particulars As at As at
31 March, 2018 31 March, 2017
Current
Loans repayable on demand
Secured - from banks
(a) Cash/packing credit (footnote ‘i’) 0.61 2.81
(b) Supplier’s credit (footnote ‘ii’) - 110.00
(c) Loan against subsidy receivable (footnote ‘iii’) - 85.96
Unsecured - from banks
(a) Working capital demand loan (footnote ‘iv’) - 50.00
(b) Supplier’s credit (footnote ‘ii’) - 273.73
0.61 522.50
Standalone Financial Statements 161