
Page 342 - Tata_Chemicals_yearly-reports-2021-22
P. 342
Integrated Annual Report 2021-22
` in crore % holding 100.00 100.00 100.00 100.00 100.00 100.00 100.00 100.00 100.00 100.00 100.00 100.00 100.00 100.00 100.00 100.00 100.00 100.00 50.06 100.00 100.00 100.00 100.00 100.00 100.00 100.00 50.00 100.00
Total Other Comprehensive Income 65.35 (18.54) (6.14) (14.53) 10.12 89.65 95.96 6.91 - 14.01 - 972.38 149.65 159.09 (120.67) 447.77 (0.27) 1.71 163.65 47.02 - - - - - 0.27 133.78 (0.91)
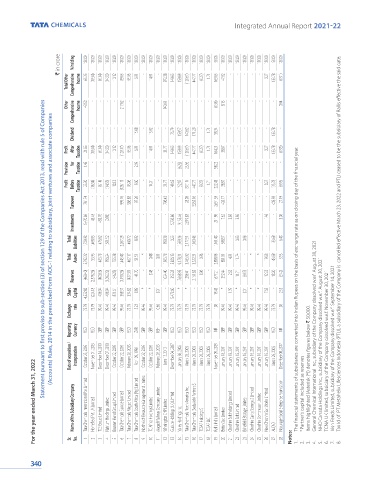
Statement pursuant to first proviso to sub-section (3) of section 129 of the Companies Act 2013, read with rule 5 of Companies
Other Income 43.50 - - - - 217.82 - - - - - 940.61 - - - - - - (0.56) 8.15 - - - - - - - 0.04
Comprehensive
(Accounts) Rules, 2014 in the prescribed Form AOC-1 relating to subsidiary, joint ventures and associate companies
Dividend - - - - - - - 15.68 - 15.02 - - 75.79 159.57 140.62 171.29 - 1.71 58.34 - - - - - - - 133.78 -
Profit After Taxation 21.85 (18.54) (6.14) (14.53) 10.12 (128.17) 95.96 6.91 - 14.01 - 31.77 149.65 159.09 (120.67) 447.77 (0.27) 1.71 164.21 38.87 - - - - - 0.27 133.78 (0.95)
Provision for Taxation 1.45 - - - - - - 2.69 - - - - - (6.22) 23.56 - - - 58.22 - - - - - - - - -
Profit Before Taxation 23.30 (18.54) (6.14) (14.53) 10.12 (128.17) 95.96 9.60 - 14.01 - 31.77 149.65 152.87 (97.11) 447.77 (0.27) 1.71 222.43 38.87 - - - - - 0.27 133.78 (0.95)
-
-
-
-
-
-
-
-
-
-
-
-
-
-
-
-
-
Turnover 781.74 999.76 586.83 97.26 796.43 28.09 3,565.16 2,631.39 405.77 403.93 27.19
Investments 5,470.60 45.48 483.70 (0.00) - - - - - - - - 5,736.86 9,155.46 2,019.83 - - - 211.90 7.62 3.98 3.98 - - - 1.46 - 3.00
Total Liabilities 1,729.90 1,408.03 476.82 1,581.52 - 2,267.29 499.72 8.92 - - - 959.30 0.25 1,509.36 2,177.51 1,160.46 - - 1,161.40 598.57 - 0.03 0.06 - - - 33.68 6.40 Tax Id of PT Metahelix Lifesciences Indonesia (PTLI), a subsidiary of the Company is cancelled effective March 23, 2022 and PTLI ceased to be the subsidiary of Rallis e
Total Assets 5,792.32 53.95 483.70 956.24 785.38 1,445.40 407.17 51.51 * 0.48 0.01 1,983.70 5,826.13 9,178.31 3,463.92 3,322.31 0.96 - 2,858.06 851.01 4.01 11.74 - * * 19.80 43.88 5.53
Reserves (460.40) (2,378.26) (400.06) (1,032.22) (46.23) (1,190.26) (427.37) 41.70 - 0.48 - 1,024.40 355.28 7,668.95 1,286.41 2,161.85 0.96 - 1,677.21 252.44 2.62 11.71 (0.07) - - 12.22 10.20 (3.42)
Share Capital 4,522.82 1,024.18 406.94 406.94 831.61 368.37 334.82 0.89 * * 0.01 - 5,470.60 * * - - - 19.45 * 1.39 * 0.01 * * 7.58 - 2.55 The financial statements of subsidiaries are converted into Indian Rupees on the basis of exchange rate as on closing day of the financial year.
Exchange rate 75.79 75.79 99.46 99.46 99.46 99.46 75.79 5.23 99.46 99.46 0.66 99.46 75.79 75.79 75.79 75.79 75.79 75.79 1.00 99.46 99.46 99.46 99.46 99.46 99.46 99.46 75.79 1.00
Reporting Currency USD USD GBP GBP GBP GBP USD ZAR GBP GBP KSH GBP USD USD USD USD USD USD INR GBP GBP GBP GBP GBP GBP GBP USD INR General Chemical International Inc., subsidiary of the Company dissolved w.e.f. August 30, 2021
Date of acqusition / incorporation October 23, 2005 November 01, 2005 December 14, 2010 December 07, 2010 October 22, 2005 October 22, 2005 February 28, 2005 April 09, 1996 October 22, 2005 October 22, 2005 February 28, 2005 June 13, 2013 December 04, 2007 January 30, 2008 March 26, 2008 March 26, 2008 March 26, 2008 March 26, 2008 November 09, 2009 January 18, 2011 January 18, 2011 January 18, 2011 January 18, 2011 Jan
For the year ended March 31, 2022 Name of the Subsidiary Company Tata Chemicals International Pte. Limited Homefield Pvt. UK Limited TCE Group Limited Natrium Holdings Limited Brunner Mond Group Limited Tata Chemicals Europe Limited Tata Chemicals Magadi Limited Tata Chemicals South Africa (Pty) Limited Northwich Resource Management Limited TC Africa Holdings Limited Magadi Railway Company Limited Winnington CHP Limited Gusiute Holdings
340 Sr. No. 1 2 3 4 5 6 7 8 9 10 11 12 13 14 15 16 17 18 19 20 21 22 23 24 25 26 27 28 Notes: 1. 2. 3. 4. 5. 6. 7. 8.