
Page 25 - Tata_Chemicals_yearly-reports-2021-22
P. 25
01 INTEGRATED 73 STATUTORY 178 FINANCIAL
Integrated Annual Report 2021-22 REPORT REPORTS STATEMENTS
Demonstrating
Resilience Sustainably
Demonstrating Resilience Sustainably
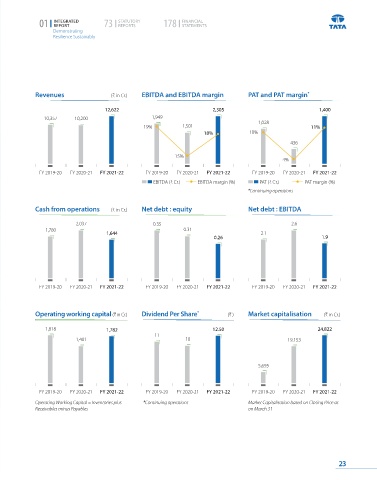
Our resilience is an outcome of competencies and enablers that we have implemented Revenues (B in Cr.) EBITDA and EBITDA margin PAT and PAT margin
*
across our business segments and operations. We continue to nurture these by 12,622 2,305 1,400
delivering greater value to stakeholders, ensuring sustainable growth and improved 10,357 10,200 1,949
business resilience. 19% 1,501 1,028 11%
18% 10%
436
15%
4%
FY 2019-20 FY 2020-21 FY 2021-22 FY 2019-20 FY 2020-21 FY 2021-22 FY 2019-20 FY 2020-21 FY 2021-22
EBITDA (B Cr.) EBITDA margin (%) PAT (B Cr.) PAT margin (%)
*Continuing operations
CFO on Performance Review
Cash from operations (B in Cr.) Net debt : equity Net debt : EBITDA
The year gone by was proof of the
resilience of Tata Chemicals as all the 2,037 0.35 2.6
manufacturing units managed supply 1,780 1,644 0.31 0.26 2.1 1.9
chain pressures and costs efficiently.
This resulted in good operating
and financial performance for the
Company. Our focus remains on
improving the ROCE and generating FY 2019-20 FY 2020-21 FY 2021-22 FY 2019-20 FY 2020-21 FY 2021-22 FY 2019-20 FY 2020-21 FY 2021-22
robust free cash flows.
*
Operating working capital (B in Cr.) Dividend Per Share (B ) Market capitalisation (B in Cr.)
Nandakumar S. Tirumalai
1,818 1,782 12.50 24,822
11
1,401 10 19,153
5,695
FY 2019-20 FY 2020-21 FY 2021-22 FY 2019-20 FY 2020-21 FY 2021-22 FY 2019-20 FY 2020-21 FY 2021-22
Operating Working Capital = Inventories plus *Continuing operations Market Capitalisation based on Closing Price as
Receivables minus Payables on March 31
22 23