
Page 89 - Tata_Chemicals_yearly-reports-2017-18
P. 89
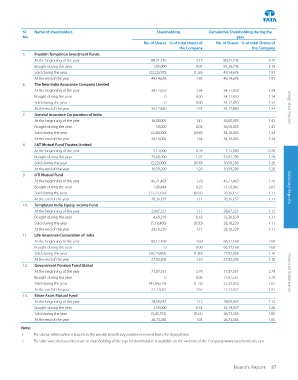
Sr.  Name of shareholders                             Shareholding        Cumulative Shareholding during the
          No.                                                                                  year
                                                          No. of Shares % of total shares of   No. of Shares % of total Shares of
                                                                         the Company                 the Company
          5.   Franklin Templeton Investment Funds
               At the beginning of the year                  80,31,746         3.15       80,31,746         3.15
               Bought during the year                         1,05,000         0.04       81,36,746         3.19
               Sold during the year                         (32,22,070)       (1.26)      49,14,676         1.93
               At the end of the year                        49,14,676         1.93       49,14,676         1.93
          6.   The New India Assurance Company Limited
               At the beginning of the year                  34,17,850         1.34       34,17,850         1.34
               Bought during the year                              0           0.00       34,17,850         1.34
               Sold during the year                                0           0.00       34,17,850         1.34
               At the end of the year                        34,17,850         1.34       34,17,850         1.34    Integrated Report
          7.   General Insurance Corporation of India
               At the beginning of the year                  36,00,005         1.41       36,00,005         1.41
               Bought during the year                          50,000          0.02       36,50,005         1.43
               Sold during the year                          (2,40,000)       (0.09)      34,10,005         1.34
               At the end of the year                        34,10,005         1.34       34,10,005         1.34
          8.   L&T Mutual Fund Trustee Limited
               At the beginning of the year                   7,13,090         0.28        7,13,090         0.28
               Bought during the year                        25,68,200         1.01       32,81,290         1.29
               Sold during the year                          (2,22,000)       (0.09)      30,59,290         1.20
               At the end of the year                        30,59,290         1.20       30,59,290         1.20
          9.   UTI Mutual Fund
               At the beginning of the year                  45,71,463         1.79       45,71,463         1.79
               Bought during the year                         5,88,444         0.23       51,59,907         2.03    Statutory Reports
               Sold during the year                         (23,23,750)       (0.91)      28,36,157         1.11
               At the end of the year                        28,36,157         1.11       28,36,157         1.11
          10.  Templeton India Equity Income Fund
               At the beginning of the year                  2,867,321         1.13       28,67,321         1.13
               Bought during the year                         4,69,318         0.18       33,36,639         1.31
               Sold during the year                          (5,18,400)       (0.20)      28,18,239         1.11
               At the end of the year                        28,18,239         1.11       28,18,239         1.11
          11.  Life Insurance Corporation of India
               At the beginning of the year                  66,17,168         2.60       66,17,168         2.60
               Bought during the year                              0           0.00       66,17,168         2.60
               Sold during the year                         (38,24,863)       (1.50)      27,92,305         1.10
               At the end of the year                        27,92,305         1.10       27,92,305         1.10
          12.  Government Pension Fund Global
               At the beginning of the year                  71,07,551         2.79       71,07,551         2.79    Financial Statements
               Bought during the year                              0           0.00       71,07,551         2.79
               Sold during the year                         (43,84,519)       (1.72)      27,23,032         1.07
               At the end of the year                        27,23,032         1.07       27,23,032         1.07
          13.  Mirae Asset Mutual Fund
               At the beginning of the year                  28,69,037         1.13       28,69,037         1.13
               Bought during the year                         3,50,000         0.14       32,19,037         1.26
               Sold during the year                          (5,45,752)       (0.21)      26,73,285         1.05
               At the end of the year                        26,73,285         1.05       26,73,285         1.05
          Note:
          1.   The above information is based on the weekly beneficiary position received from the depositories
          2.   The date wise increase/decrease in shareholding of the top 10 shareholders is available on the website of the Company www.tatachemicals.com


                                                                                              Board's Report  87