
Page 86 - Tata_Chemicals_yearly-reports-2017-18
P. 86
Annexure C
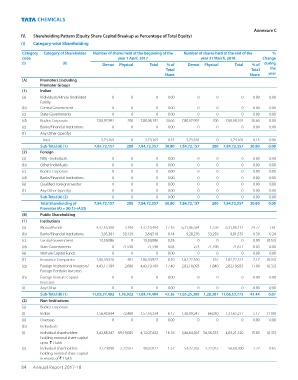
IV. Shareholding Pattern (Equity Share Capital Breakup as Percentage of Total Equity)
(i) Category-wise Shareholding
Category Category of Shareholder Number of shares held at the beginning of the Number of shares held at the end of the %
code year 1 April, 2017 year 31 March, 2018 Change
(I) (II) Demat Physical Total % of Demat Physical Total % of during
Total Total the
Share Share year
(A) Promoters (including
Promoter Group)
(1) Indian
(a) Individuals/Hindu Undivided 0 0 0 0.00 0 0 0 0.00 0.00
Family
(b) Central Government 0 0 0 0.00 0 0 0 0.00 0.00
(c) State Governments 0 0 0 0.00 0 0 0 0.00 0.00
(d) Bodies Corporate 7,80,97,992 200 7,80,98,192 30.66 7,80,97,992 200 7,80,98,192 30.66 0.00
(e) Banks/Financial Institutions 0 0 0 0.00 0 0 0 0.00 0.00
(f) Any Other (specify)
- Trust 3,74,165 0 3,74,165 0.15 3,74,165 0 3,74,165 0.15 0.00
Sub-Total (A) (1) 7,84,72,157 200 7,84,72,357 30.80 7,84,72,157 200 7,84,72,357 30.80 0.00
(2) Foreign
(a) NRIs - Individuals 0 0 0 0.00 0 0 0 0.00 0.00
(b) Other Individuals 0 0 0 0.00 0 0 0 0.00 0.00
(c) Bodies Corporate 0 0 0 0.00 0 0 0 0.00 0.00
(d) Banks/Financial Institutions 0 0 0 0.00 0 0 0 0.00 0.00
(e) Qualified Foreign Investor 0 0 0 0.00 0 0 0 0.00 0.00
(f) Any Other (specify) 0 0 0 0.00 0 0 0 0.00 0.00
Sub-Total (A) (2) 0 0 0 0.00 0 0 0 0.00 0.00
Total Shareholding of 7,84,72,157 200 7,84,72,357 30.80 7,84,72,157 200 7,84,72,357 30.80 0.00
Promoter (A) = (A)(1)+(A)(2)
(B) Public Shareholding
(1) Institutions
(a) Mutual Funds 4,37,16,300 3,194 4,37,19,494 17.16 6,31,06,584 1,528 6,31,08,112 24.77 7.61
(b) Banks/Financial Institutions 3,05,381 59,129 3,64,510 0.14 9,28,276 53,259 9,81,535 0.39 0.24
(c) Central Government 13,59,086 0 13,59,086 0.53 0 0 0 0.00 (0.53)
(d) State Governments 0 71,598 71,598 0.03 273 71,598 71,871 0.03 0.00
(e) Venture Capital Funds 0 0 0 0.00 0 0 0 0.00 0.00
(f) Insurance Companies 2,06,39,526 401 2,06,39,927 8.10 1,82,72,160 162 1,82,72,322 7.17 (0.93)
(g) Foreign Institutional Investors/ 4,43,17,189 2,600 4,43,19,789 17.40 2,82,18,093 1,840 2,82,19,933 11.08 (6.32)
Foreign Portfolio Investors
(h) Foreign Venture Capital 0 0 0 0.00 0 0 0 0.00 0.00
Investors
(i) Any Other 0 0 0 0.00 0 0 0 0.00 0.00
Sub-Total (B) (1) 11,03,37,482 1,36,922 11,04,74,404 43.36 11,05,25,386 1,28,387 11,06,53,773 43.44 0.07
(2) Non-Institutions
(a) Bodies Corporate
(i) Indian 1,56,43,934 72,400 1,57,16,334 6.17 1,30,99,247 66,030 1,31,65,277 5.17 (1.00)
(ii) Overseas 0 0 0 0.00 0 0 0 0.00 0.00
(b) Individuals
(i) Individual shareholders 3,42,88,347 69,19,085 4,12,07,432 16.18 3,46,64,567 56,56,553 4,03,21,120 15.83 (0.35)
holding nominal share capital
upto ` 1 lakh
(ii) Individual shareholders 37,79,890 2,22,937 40,02,827 1.57 54,37,763 2,22,937 56,60,700 2.22 0.65
holding nominal share capital
in excess of ` 1 lakh
84 Annual Report 2017-18