
Page 87 - Tata_Chemicals_yearly-reports-2017-18
P. 87
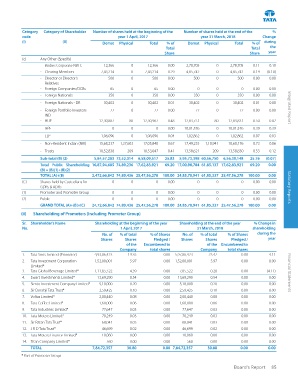
Category   Category of Shareholder   Number of shares held at the beginning of the   Number of shares held at the end of the    %
          code                                  year 1 April, 2017               year 31 March, 2018      Change
          (I)             (II)            Demat  Physical    Total  % of    Demat  Physical    Total  % of   during
                                                                   Total                             Total   the
                                                                   Share                             Share  year
          (c)    Any Other (Specify)
                 -   Bodies Corporate NBFC  12,366   0      12,366  0.00   2,78,705    0     2,78,705  0.11  0.10
                 -   Clearing Members    7,43,214    0     7,43,214  0.29  4,85,742    0     4,85,742  0.19  (0.10)
                 -   Director or Director’s    500   0        500   0.00      500      0        500   0.00  0.00
                  Relatives
                 -   Foreign Companies/OCBs  65      0         65   0.00        0      0         0    0.00  0.00
                 -   Foreign Nationals      350      0        350   0.00      350      0        350   0.00  0.00
                 -   Foreign Nationals - DR  30,402  0      30,402  0.01    30,402     0      30,402  0.01  0.00
                 -   Foreign Portfolio Investors  77  0        77   0.00       77      0        77    0.00  0.00    Integrated Report
                  IND
                 -   HUF                 12,30,887   80   12,30,967  0.48  12,83,751   80   12,83,831  0.50  0.02
                 -   IEPF                     0      0         0    0.00  10,01,576    0    10,01,576  0.39  0.39
                 -   LLP                 1,06,096    0     1,06,096  0.04  1,82,862    0     1,82,862  0.07  0.03
                 -   Non-Resident Indian (NRI)  15,68,237  1,37,603  17,05,840  0.67  17,49,235  1,10,941  18,60,176  0.73  0.06
                 -   Trusts              10,52,838  209   10,53,047  0.41  13,58,621  209   13,58,830  0.53  0.12
                 Sub-total (B) (2)     5,84,57,203 73,52,314  6,58,09,517  25.83  5,95,73,398 60,56,750  6,56,30,148  25.76  (0.07)
                 Total Public Shareholding  16,87,94,685 74,89,236 17,62,83,921  69.20 17,00,98,784 61,85,137 17,62,83,921  69.20  0.00
                 (B) = (B)(1)+(B)(2)
                 TOTAL (A)+(B)        2,472,66,842 74,89,436 25,47,56,278  100.00 24,85,70,941 61,85,337 25,47,56,278  100.00  0.00
          (C)    Shares held by Custodians for   0   0         0    0.00        0      0         0    0.00  0.00
                 GDRs & ADRs                                                                                        Statutory Reports
          (1)    Promoter and Promoter Group  0      0         0    0.00        0      0         0    0.00  0.00
          (2)    Public                       0      0         0    0.00        0      0         0    0.00  0.00
                 GRAND TOTAL (A)+(B)+(C)  24,72,66,842 74,89,436 25,47,56,278  100.00 24,85,70,941 61,85,337 25,47,56,278  100.00  0.00
          (ii)    Shareholding of Promoters (Including Promoter Group)
          Sr.  Shareholder’s Name      Shareholding at the beginning of the year   Shareholding at the end of the year   % Change in
          No.                                    1 April, 2017                  31 March, 2018        shareholding
                                          No. of   % of total   % of Shares   No. of   % of total   % of Shares   during the
                                         Shares    Shares     Pledged /   Shares   Shares    Pledged /      year
                                                   of the   Encumbered to           of the  Encumbered to
                                                 Company     total shares        Company    total shares
          1.  Tata Sons Limited (Promoter)  4,93,06,423  19.35    0.00  5,97,86,423  23.47       0.00       4.11
          2.  Tata Investment Corporation   1,52,00,001  5.97     0.00  1,52,00,001  5.97        0.00       0.00
             Limited*
          3.  Tata Global Beverage Limited*  1,11,85,522  4.39    0.00   7,05,522    0.28        0.00      (4.11)   Financial Statements
          4.  Ewart Investments Limited*  13,69,290  0.54         0.00  13,69,290    0.54        0.00       0.00
          5.  Simto Investment Company Limited*  5,18,000  0.20   0.00   5,18,000    0.20        0.00       0.00
          6.  Sir Dorabji Tata Trust*    2,59,425    0.10         0.00   2,59,425    0.10        0.00       0.00
          7.  Voltas Limited*            2,00,440    0.08         0.00   2,00,440    0.08        0.00       0.00
          8.  Tata Coffee Limited*        1,60,000    0.06         0.00   1,60,000    0.06        0.00       0.00
          9.  Tata Industries Limited*    77,647     0.03         0.00    77,647     0.03        0.00       0.00
          10. Tata Motors Limited*        70,249     0.03         0.00    70,249     0.03        0.00       0.00
          11. Sir Ratan Tata Trust*       68,041     0.03         0.00    68,041     0.03        0.00       0.00
          12. J R D Tata Trust*           46,699     0.02         0.00    46,699     0.02        0.00       0.00
          13. Tata Motors Finance Limited*  10,060   0.00         0.00    10,060     0.00        0.00       0.00
          14. Titan Company Limited*        560      0.00         0.00      560      0.00        0.00       0.00
             TOTAL                    7,84,72,357   30.80         0.00 7,84,72,357  30.80        0.00       0.00
          * Part of Promoter Group
                                                                                              Board's Report  85