
Page 216 - Tata_Chemicals_yearly-reports-2017-18
P. 216
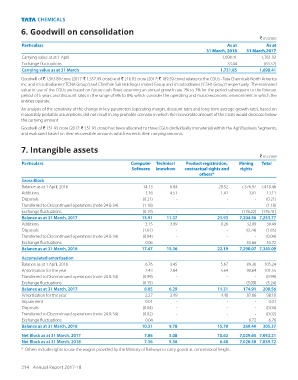
6. Goodwill on consolidation

                                                                                                         ` in crore
          Particulars                                                                       As at          As at
                                                                                   31 March, 2018  31 March,2017
          Carrying value as at 1 April                                                    1,698.41        1,761.93
          Exchange fluctuations                                                              33.44          (63.52)
          Carrying value as at 31 March                                                  1,731.85        1,698.41
          Goodwill of ` 1,363.89 crore (2017: ` 1,357.09 crore) and ` 216.03 crore (2017: ` 189.39 crore) relates to the CGUs - Tata Chemicals North America
          Inc. and it’s subsidiaries (‘TCNA Group’) and Cheshire Salt Holdings Limited Group and it’s subsidiaries (‘CSHL Group’) respectively.  The estimated
          value in use of the CGUs are based on future cash flows assuming an annual growth rate 2% to 3% for the period subsequent to the forecast
          period of 5 years and discount rates in the range of 6% to 8%, which consider the operating and macro-economic environment in which the
          entities operate.
          An analysis of the sensitivity of the change in key parameters (operating margin, discount rates and long term average growth rate), based on
          reasonably probable assumptions, did not result in any probable scenario in which the recoverable amount of the CGUs would decrease below
          the carrying amount.
          Goodwill of ` 151.93 crore (2017: ` 151.93 crore) has been allocated to three CGUs (Individually immaterial) within the Agri Business Segments,
          and evaluated based on their recoverable amounts which exceeds their carrying amounts.

          7. Intangible assets
                                                                                                         ` in crore
          Particulars                                Computer  Technical   Product registration,   Mining   Total
                                                      Software  knowhow    contractual rights and   rights
                                                                                others*
          Gross Block
          Balance as at 1 April, 2016                      14.13     6.84                20.52    7,376.97   7,418.46
          Additions                                         3.36     4.53                 1.41       3.81    13.11
          Disposals                                        (0.21)       -                   -          -      (0.21)
          Transferred to Discontinued operations (note 24 & 34)   (1.18)   -                -          -      (1.18)
          Exchange fluctuations                             (0.19)       -                   -      (176.22)   (176.41)
          Balance as at 31 March, 2017                    15.91     11.37               21.93    7,204.56   7,253.77
          Additions                                         3.15     3.99                 0.26      32.09    39.49
          Disposals                                        (1.61)       -                   -       (0.24)   (1.85)
          Transferred to Discontinued operations (note 24 & 34)   (0.04)   -                -          -      (0.04)
          Exchange fluctuations                              0.06        -                   -       53.66    53.72
          Balance as at 31 March, 2018                    17.47     15.36               22.19    7,290.07   7,345.09

          Accumulated amortisation
          Balance as at 1 April, 2016                       6.76     3.45                 5.67      89.36    105.24
          Amortisation for the year                         2.43     2.84                 5.64      90.64    101.55
          Transferred to Discontinued operations (note 24 & 34)   (0.99)   -                -          -      (0.99)
          Exchange fluctuations                             (0.15)       -                   -       (5.09)   (5.24)
          Balance as at 31 March, 2017                     8.05      6.29               11.31      174.91    200.56
          Amortisation for the year                         2.27     3.49                 4.48      87.86    98.10
          Impairment                                        0.01        -                   -          -      0.01
          Disposals                                        (0.04)       -                   -          -      (0.04)
          Transferred to Discontinued operations (note 24 & 34)   (0.02)   -                -          -      (0.02)
          Exchange fluctuations                              0.04        -                   -        6.72    6.76
          Balance as at 31 March, 2018                    10.31      9.78               15.79      269.49    305.37
          Net Block as at 31 March, 2017                   7.86      5.08               10.62    7,029.65   7,053.21
          Net Block as at 31 March, 2018                   7.16      5.58                6.40    7,020.58   7,039.72
          *  Others include rights to use the wagon provided by the Ministry of Railways to carry goods at concessional freight.


          214  Annual Report 2017-18