
Page 156 - Tata_Chemicals_yearly-reports-2017-18
P. 156
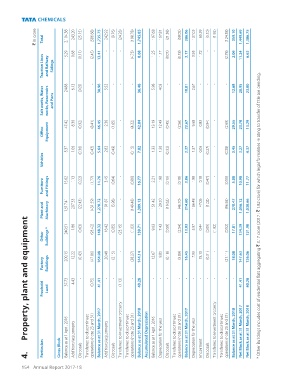
` in crore  Total   2,104.38   243.20   (25.15)   (586.68)   1,735.75   242.92   (9.76)   (24.28)   (198.78)   1,745.85   197.68   167.81   (21.38)   (58.05)   286.06   137.05   65.39   (3.10)   (1.92)   (124.38)   359.10   1,449.69   1,386.75


                  Traction Lines   and Railway   Sidings   15.29    0.68    (0.11)   (2.45)   13.41    -    -    -    (4.73)   8.68    1.25    1.17    (0.07)   (0.18)   2.17    0.95    1.72    -    -    (2.78)   2.06    11.24    6.62


                  Salt works, Water   works, Reservoirs   and Pans   24.88    6.13    (0.05)   -    30.96    5.52    -    -    -    36.48    5.98    4.03    -    -    10.01    2.67    -    -    -    -    12.68    20.95    23.80


                  Office   Equipment   47.42    8.36    (0.92)   (8.41)   46.45    2.36    (1.65)   -    (4.32)   42.84    13.19    12.49    (0.45)   (2.56)   22.67    9.68    0.83    (0.94)   -    (2.69)   29.55    23.78    13.29


                             5.37    1.06    (0.36)   (0.43)   5.64    2.82    (0.49)   -    (0.15)   7.82    1.33    1.36    (0.32)   -    2.37    1.37    0.06    (0.27)   -    (0.08)   3.45    3.27    4.37
                  Vehicles


                  Furniture   and Fittings   15.62    1.13    (0.22)   (1.77)   14.76    3.45    (0.64)   -    (0.80)   16.77    2.21    1.98    (0.15)   (0.18)   3.86    1.98    0.18    (0.47)   -    (0.55)   5.00    10.90    11.77


                  Plant and   Machinery   1,517.41    207.33    (22.43)   (431.59)   1,270.72    191.87    (3.98)   -    (149.48)   1,309.13    151.42    129.50    (19.62)   (46.70)   214.60    106.48    47.06    (1.02)   -    (96.65)   270.47    1,056.12    1,038.66  * Other Buildings includes cost of residential flats aggregating ` 3.17 crore (2017 : ` 1.82 crore) for which legal formalities relating to transfer of title are pending.


            3URSHUW\  SODQW DQG HTXLSPHQW

                  Other   Buildings *   240.51    1.86    (0.63)   (93.42)   148.32    16.42    (0.85)   (23.15)   (1.03)   139.71    9.63    7.43    (0.59)   (2.54)   13.93    5.97    0.44    (0.09)   (1.92)   (0.52)   17.81    134.39    121.90


                  Factory   Buildings   200.15    12.22    (0.43)   (47.86)   164.08    20.48    (2.15)   -    (38.27)   144.14    12.67    9.85    (0.18)   (5.89)   16.45    7.95    15.10    (0.31)   -    (21.11)   18.08    147.63    126.06


                  Freehold   Land   37.73    4.43    -    (0.75)   41.41    -    -    (1.13)   -    40.28    -    -    -    -    -    -    -    -    -    -    -    41.41    40.28


                            Balance as at 1 April, 2016  Additions/adjustments  Transferred to discontinued  operations (note 23 and 31)  Balance as at 31 March, 2017  Additions/adjustments  Transferred to Investment property  Transferred to discontinued  operations (note 23 and 31)  Balance as at 31 March, 2018  Accumulated Depreciation  Balance as at 1 April, 2016  Depreciation for the year  Transferred to discontinued  operations (note 23 and 31)  Balance as at 31


                  Particulars  Gross Block  Disposals  Disposals    Disposals    Impairment  Disposals


          154 Annual Report 2017-18