
Page 103 - Tata_Chemicals_yearly-reports-2017-18
P. 103
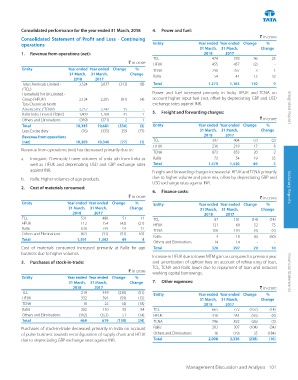
Consolidated performance for the year ended 31 March, 2018   4.   Power and fuel:
                                                                                                         ` in crore
          Consolidated Statement of Profit and Loss - Continuing
          operations                                          Entity            Year ended  Year ended   Change   %
                                                                                 31 March,  31 March,    Change
          1.   Revenue from operations (net):                                     2018     2017
                                                              TCL                     474     378      96     25
                                                    ` in crore
                                                              HFUK                    455     457      (2)     -
          Entity            Year ended  Year ended   Change   %   TCNA                290     287       3      1
                             31 March,  31 March,    Change
                                                              Rallis                  54       41      13     32
                              2018     2017
          Tata Chemicals Limited -    3,524   3,837   (313)   (8)  Total            1,273    1,163    110      9
          (‘TCL’)
          Homefield Pvt UK Limited -                           Power and fuel increased primarily in India, HFUK and  TCNA on
          Group (‘HFUK’)         2,124    2,205   (81)    (4)  account higher input fuel cost, offset by depreciating GBP and USD
          Tata Chemicals North                                exchange rates against INR.
          America Inc (‘TCNA’)   3,257    3,242    15      -                                                        Integrated Report
          Rallis India Limited (‘Rallis’)   1,809   1,768   41   2  5.   Freight and forwarding charges:
          Others and Eliminations   (369)   (371)  2      1                                              ` in crore
          Total                 10,345   10,681   (336)   (3)  Entity           Year ended  Year ended   Change   %
          Less: Excise duty       (76)    (335)   259    (77)                    31 March,  31 March,    Change
          Revenue from operations                                                 2018     2017
          (net)                 10,269   10,346   (77)   (1)  TCL                     397     404      (7)    (2)
                                                              HFUK                    236     219      17      8
          Revenue from operations (net) has decreased primarily due to :
                                                              TCNA                    873     853      20      2
          a.   Inorganic Chemicals: Lower volumes of soda ash from India as   Rallis  73       54      19     35
             well as HFUK and depreciating USD and GBP exchange rates   Total       1,579    1,530     49      3
             against INR.                                     Freight and forwarding charges increased at HFUK and TCNA primarily
                                                              due to higher volume and price mix, offset by depreciating GBP and
          b.   Rallis: Higher volumes of agri products.
                                                              USD exchange rates against INR.
          2.   Cost of materials consumed:                                                                          Statutory Reports
                                                              6.  Finance costs:
                                                    ` in crore                                           ` in crore
          Entity            Year ended  Year ended   Change   %   Entity        Year ended  Year ended   Change   %
                            31 March,  31 March,     Change                      31 March,  31 March,    Change
                              2018     2017                                       2018     2017
          TCL                    531      480     51      11  TCL                     87      101     (14)   (14)
          HFUK                   112      154     (42)   (27)  HFUK                   121      69      52     75
          Rallis                 830      739     91      12
                                                              TCNA                    100     103      (3)    (3)
          Others and Eliminations   (82)   (31)   (51)  165
                                                              Rallis                   4       10      (6)   (60)
          Total                 1,391   1,342     49      4
                                                              Others and Eliminations   14      14      -      -
          Cost of materials consumed increased primarily at Rallis for agri   Total  326      297      29     10
          business due to higher volumes.
                                                              Increase in HFUK due to lower MTM gain as compared to previous year
          3.   Purchases of stock-in-trade:                   and amortisation of upfront fees on account of refinancing of loan.
                                                              TCL, TCNA and Rallis lower due to repayment of loan and reduced
                                                    ` in crore
                                                              working capital borrowings.                           Financial Statements
          Entity            Year ended  Year ended   Change   %
                            31 March,  31 March,     Change   7.  Other expenses:
                              2018     2017                                                              ` in crore
          TCL                    219      449    (230)   (51)
                                                              Entity            Year ended  Year ended   Change   %
          HFUK                   332      391     (59)   (15)
                                                                                 31 March,  31 March,    Change
          TCNA                    18       22     (4)    (18)                     2018     2017
          Rallis                 202      110     92      84  TCL                     665     772    (107)   (14)
          Others and Eliminations   (302)   (353)   51   (14)  HFUK                   418     454     (36)    (8)
          Total                  469      619    (150)   (24)  TCNA                   796     822     (26)    (3)
          Purchases of stock-in-trade decreased primarily in India on account   Rallis  203   307    (104)   (34)
          of pulse business towards reconfiguration of supply chain and HFUK   Others and Eliminations   16   (19)   35   (184)
          due to depreciating GBP exchange rates against INR.  Total                2,098    2,336   (238)   (10)


                                                                           Management Discussion and Analysis  101