
Page 9 - Tata Chemical Annual Report_2022-2023
P. 9
Integrated Annual Report 2022-23 01-83 84-192 193-365
Integrated Report Statutory Reports Financial Statements
Key Financial Outcomes
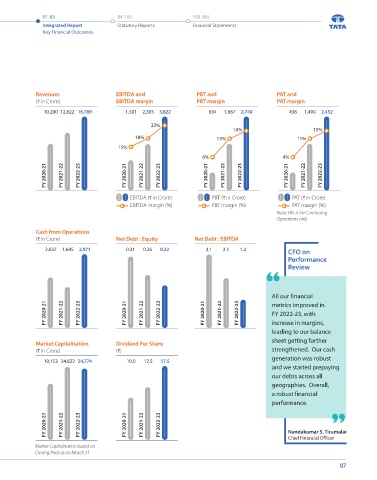
Key Financial Outcomes
Tata Chemicals delivered another strong set of numbers during FY 2022-23, with Revenue up by D 4,167 Crore and EBITDA by
D 1,517 Crore as we channeled the benefit of improved realisations, while progressing steadfastly on our strategic trajectory.
Our focus on serving customers further aided us in driving growth, as we continued to invest in being their partner of choice. Revenues EBITDA and PBT and PAT and
(C in Crore) EBITDA margin PBT margin PAT margin
Our growth is an outcome of our sustained focus on sharpening our core competencies. At the same time, it is driven by
our continuous efforts to nurture the business by being responsible corporate citizens and delivering greater value to 10,200 12,622 16,789 1,501 2,305 3,822 634 1,667 2,740 436 1,400 2,452
our stakeholders. We believe our strengths and efforts are together helping us ensure sustainable growth. They are also 23%
concurrently enabling us to work with our stakeholder groups to deliver on our objective of a sustainable future. 16% 15%
18% 13% 11%
15%
C in Crore (except for no. of shares)
Standalone Consolidated 6% 4%
Particulars FY 2022-23 FY 2021-22 FY 2020-21 FY 2022-23 FY 2021-22 FY 2020-21
Revenue from Operations 4,930 3,721 2,999 16,789 12,622 10,200 FY 2020-21 FY 2021-22 FY 2022-23 FY 2020-21 FY 2021-22 FY 2022-23 FY 2020-21 FY 2021-22 FY 2022-23 FY 2020-21 FY 2021-22 FY 2022-23
EBITDA 1,235 951 611 3,822 2,305 1,501
Profit Before Tax (PBT) 1,265 988 614 2,740 1,667 634
Profit After Tax (PAT) 1,027 787 479 2,452 1,400 436 EBITDA (C in Crore) PBT (C in Crore) PAT (C in Crore)
PAT including discontinued operations 1,027 802 479 2,434 1,405 436 EBITDA margin (%) PBT margin (%) PAT margin (%)
Other Comprehensive Income (59) 1,538 1,081 (531) 2,959 1,417 Note: PAT is for Continuing
Total Comprehensive Income 968 2,340 1,560 1,903 4,364 1,853 Operations only
Cash from Operations
Share Capital 255 255 255 255 255 255 (C in Crore) Net Debt : Equity Net Debt : EBITDA
Other Equities 15,737 15,087 13,002 19,466 17,998 14,035
Non-Controlling Interest - - - 921 904 853 2,037 1,645 2,971 0.31 0.26 0.22 3.1 2.1 1.2 CFO on
Networth 15,992 15,342 13,257 20,642 19,157 15,143 Performance
Review
Borrowings 1 - 3 9 6,296 7,024 6,933
Non-Current - - 5 5,677 3,860 5,388
Current - 3 4 619 3,164 1,545 All our financial
Cash and Cash Equivalents (including 1,134 1,606 1,967 1,935 2,636 2,975
Deposits with < 12 months maturity & metrics improved in
Current Investments) FY 2020-21 FY 2021-22 FY 2022-23 FY 2020-21 FY 2021-22 FY 2022-23 FY 2020-21 FY 2021-22 FY 2022-23 FY 2022-23, with
Capital Employed 2 15,992 15,345 13,266 26,938 26,181 22,076 increase in margins,
Borrowings : Networth - * * 0.31 0.37 0.46 leading to our balance
Networth per share (in ₹) 628 602 520 774 716 561 sheet getting further
Earnings Per Share (EPS) - Basic & 40.31 30.87 18.81 91.66 49.17 10.06 Market Capitalisation Dividend Per Share strengthened. Our cash
(C)
(C in Crore)
Diluted (continuing operations) (in ₹) generation was robust
Dividend per share paid 17.50 12.50 10.00 17.50 12.50 10.00 19,153 24,822 24,774 10.0 12.5 17.5
(proposed for FY 2022-23) (in ₹) and we started prepaying
No. of Shares 25,47,56,278 25,47,56,278 25,47,56,278 25,47,56,278 25,47,56,278 25,47,56,278 our debts across all
Notes: geographies. Overall,
1 Includes Lease Liabilities a robust financial
2 Capital Employed = Networth plus Borrowings performance.
* Less than 0.00
FY 2020-21 FY 2021-22 FY 2022-23 FY 2020-21 FY 2021-22 FY 2022-23 Nandakumar S. Tirumalai
Chief Financial Officer
Market Capitalisation based on
Closing Price as on March 31
06 07