
Page 367 - Tata Chemical Annual Report_2022-2023
P. 367
Integrated Annual Report 2022-23 01-83 84-192 193-365
Integrated Report Statutory Reports Financial Statements
Consolidated
` in crore % holding 100.00 100.00 100.00 100.00 100.00 100.00 100.00 100.00 100.00 100.00 100.00 100.00 100.00 100.00 100.00 100.00 100.00 100.00 50.06 100.00 100.00 100.00 100.00 100.00 100.00 50.00 100.00 ` in crore Profit / Loss for the year Not Considered in Consolidation Not Applicable Not Applicable Not Applicable Not Applicable
Total Other Comprehensive Income (318) (68) (109) (122) (45) 96 460 11 - 2 - (652) (5) 203 (75) 800 * 9 92 122 (1) - - - 1 146 * - - 57 (77)
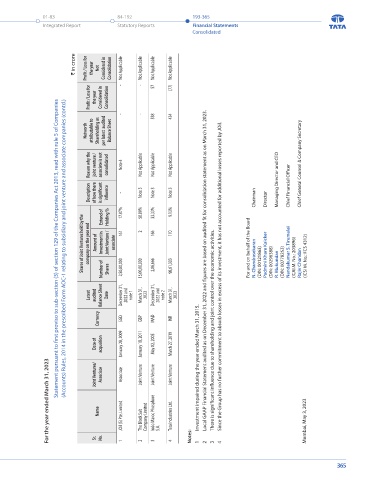
Statement pursuant to first proviso to sub-section (3) of section 129 of the Companies Act 2013, read with rule 5 of Companies
Comprehensive - - 538 434
Other Income 17 - - - - (64) - - - - - (795) - - - - - - * (43) - - - - - - * Profit / Loss for the year Considered in Consolidation
(Accounts) Rules, 2014 in the prescribed Form AOC-1 relating to subsidiary and joint ventures and associate companies
Dividend - - - - - - - 2 - 3 - - - - - 915 - 9 58 - - 1,135 - - - 145 - Networth attributable to Shareholding as per latest audited Balance Sheet
Profit After Taxation (335) (68) (109) (122) (45) 160 460 11 - 2 - 143 (5) 203 (75) 800 * 9 92 165 (1) - - - 1 146 *
Provision for Taxation - - - - (22) (99) (11) 4 - - - 37 - (13) 73 - - - 36 28 - - - - - - - Reason why the joint venture / associate is not consolidated Note 4 Not Applicable Not Applicable Not Applicable Chief General Counsel & Company Secretary
Profit Before Taxation (335) (68) (109) (122) (67) 61 449 15 - 2 - 180 (5) 190 (2) 800 * 9 128 193 (1) - - - 1 146 * Description of how there is significant - Note 3 Note 3 Note 3 Managing Director and CEO Chief Financial Officer
Turnover 139 - - - - 1,497 966 136 - - - 1,082 - - 34 5,175 - - 2,967 674 - - - - - 443 21 influence 9.13% Chairman Director
Investments 5,931 49 494 * - - - - - - - - 6,311 9,926 2,163 - - - 223 8 4 4 - - 1 - 1 Extend of Holding % 17.07% 50.00% 33.33%
Total Liabilities 1,876 1,342 503 1,536 - 2,270 254 21 - - - 649 1 1,639 1,806 1,499 - - 1,068 615 - * * - - 43 4 Shares of Joint Ventures held by the company on the year end Amount of Investment in Joint Venture / associate 161 2 166 170
Total Assets 5,961 57 494 868 851 1,619 613 67 * * * 1,044 6,312 10,156 3,784 3,697 1 - 2,798 995 3 12 - * 21 55 3 Statement pursuant to first proviso to sub-section (3) of section 129 of the Companies Act 2013, read with rule 5 of Companies (Accounts) Rules, 2014 in the prescribed Form AOC-1 relating to subsidiary and joint venture and associate companies (contd.) 2,06,666
Reserves (818) (2,646) (518) (1,177) 81 (1,121) (4) 45 - * - 395 380 8,517 1,978 2,198 1 - 1,711 380 2 12 - - 13 12 (4) The financial statements of subsidiaries are converted into Indian Rupees on the basis of exchange rate as on closing day of the financial year. Number of Shares 2,50,00,000 15,00,00,000 Local GAAP Financial Statement audited as on December 31, 2022 and f
Share Capital 4,903 1,361 509 509 770 470 363 1 * * * - 5,931 * * - - - 19 * 1 * - * 8 - 3 Latest audited Balance Sheet Date December 31, 2022 and note 1 March 31, 2023 December 31, 2022 and note 2 March 31, 2023
Exchange rate 82.17 82.17 101.65 101.65 101.65 101.65 82.17 4.62 101.65 101.65 0.62 101.65 82.17 82.17 82.17 82.17 82.17 82.17 1.00 101.65 101.65 101.65 101.65 101.65 101.65 82.17 1.00 Currency SGD GBP MAD INR
Reporting Currency USD USD GBP GBP GBP GBP USD ZAR GBP GBP KSH GBP USD USD USD USD USD USD INR GBP GBP GBP GBP GBP GBP USD INR There is significant influence due to shareholding and joint control over the economic activities.
Date of acqusition / incorporation October 23, 2005 November 01, 2005 December 14, 2010 December 07, 2010 October 22, 2005 October 22, 2005 February 28, 2005 April 09, 1996 October 22, 2005 October 22, 2005 February 28, 2005 June 13, 2013 December 04, 2007 January 30, 2008 March 26, 2008 March 26, 2008 March 26, 2008 March 26, 2008 November 09, 2009 January 18, 2011 January 18, 2011 January 18, 2011 January 18, 2011 January 18, 2011 January
For the year ended March 31, 2023 Name of the Subsidiary Company Tata Chemicals International Pte. Limited Homefield Pvt. UK Limited TCE Group Limited Natrium Holdings Limited Brunner Mond Group Limited Tata Chemicals Europe Limited Tata Chemicals Magadi Limited Tata Chemicals South Africa (Pty) Limited Northwich Resource Management Limited TC Africa Holdings Limited Magadi Railway Company Limited Winnington CHP Limited Gusiute Holdings (UK) Limite
364 Sr. No. 1 2 3 4 5 6 7 8 9 10 11 12 13 14 15 16 17 18 19 20 21 22 23 24 25 26 27 Notes: 1. 2. 3. 4. Sr. No. 1 2 3 4 Notes: 1 2 3 4 365