
Page 357 - Tata Chemical Annual Report_2022-2023
P. 357
Integrated Annual Report 2022-23 01-83 84-192 193-365
Integrated Report Statutory Reports Financial Statements
Consolidated
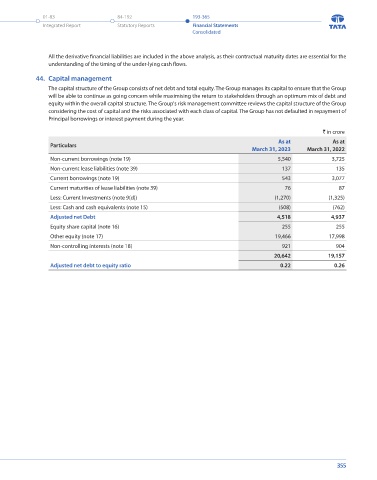
Financial instruments and cash deposits All the derivative financial liabilities are included in the above analysis, as their contractual maturity dates are essential for the
Credit risk from balances/investments with banks and financial institutions is managed in accordance with the Risk understanding of the timing of the under-lying cash flows.
management policy. Investments of surplus funds are made only with approved counterparties and within limits assigned
to each counterparty. The limits are assigned based on corpus of investable surplus and corpus of the investment avenue. 44. Capital management
The limits are set to minimise the concentration of risks and therefore mitigate financial loss through counterparty’s The capital structure of the Group consists of net debt and total equity. The Group manages its capital to ensure that the Group
potential failure to make payments. will be able to continue as going concern while maximising the return to stakeholders through an optimum mix of debt and
equity within the overall capital structure. The Group's risk management committee reviews the capital structure of the Group
Liquidity risk considering the cost of capital and the risks associated with each class of capital. The Group has not defaulted in repayment of
Liquidity risk is the risk that the Group will not be able to meet its financial obligations as they become due. The Principal borrowings or interest payment during the year.
objective of liquidity risk management is to maintain sufficient liquidity and ensure that funds are available for use as ` in crore
per requirements.
As at As at
Particulars
The Risk Management Policy includes an appropriate liquidity risk management framework for the management of the Group's March 31, 2023 March 31, 2022
short-term, medium-term and long term funding and liquidity management requirements. The Group manages the liquidity risk Non-current borrowings (note 19) 5,540 3,725
by maintaining adequate reserves, banking facilities and reserve borrowing facilities, by continuously monitoring forecast and Non-current lease liabilities (note 39) 137 135
actual cash flows, and by matching the maturity profiles of financial assets and liabilities. The Group invests its surplus funds in Current borrowings (note 19) 543 3,077
bank fixed deposit and liquid schemes of mutual funds, which carry no/negligible mark to market risks.
Current maturities of lease liabilities (note 39) 76 87
The below table analyses the Group’s non-derivative financial liabilities as at the reporting date, into relevant maturity groupings Less: Current Investments (note 9(d)) (1,270) (1,325)
based on the remaining period (as at that date) to the contractual maturity date. The amounts disclosed in the below table are Less: Cash and cash equivalents (note 15) (508) (762)
the contractual undiscounted cash flows. Adjusted net Debt 4,518 4,937
` in crore Equity share capital (note 16) 255 255
Particulars Carrying amount Up-to 1 year 1-5 years Above 5 years Total Other equity (note 17) 19,466 17,998
As at March 31, 2023 Non-controlling interests (note 18) 921 904
Borrowings and future interest thereon 6,083 588 6,644 - 7,232 20,642 19,157
Lease liabilities 213 84 92 70 246 Adjusted net debt to equity ratio 0.22 0.26
Trade and other payables 3,186 3,138 48 - 3,186
Total 9,482 3,810 6,784 70 10,664
As at March 31, 2022
Borrowings and future interest thereon 6,802 3,190 3,929 - 7,119
Lease liabilities 222 105 116 75 296
Trade and other payables 2,898 2,882 16 - 2,898
Total 9,922 6,177 4,061 75 10,313
The below table analyses the Group’s derivative financial liabilities into relevant maturity groupings based on the remaining
period (as at the reporting date) to the contractual maturity date.
` in crore
As at As at
Particulars
March 31, 2023 March 31, 2022
Current portion 132 21
Non-current portion (within one - three years) 23 -
Total 155 21
354 355