
Page 360 - Tata_Chemicals_yearly-reports-2021-22
P. 360
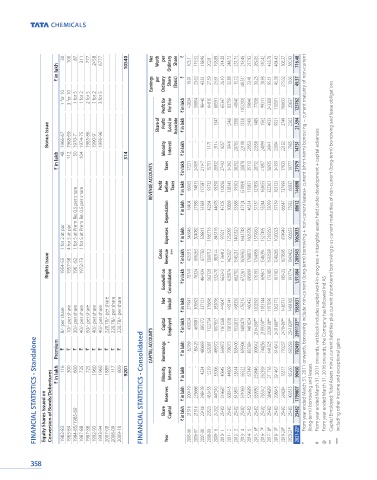
30  100  87  311  777  2458  6777  10540  Net   Worth   per   Ordinary   Share  `  103.11  119.52  158.96  202.81  193.89  214.00  248.72  251.75  218.46  217.92  269.05  310.42  435.78  484.43  506.27  560.93  716.48
                   ` in lakh                               `

                                                 Earnings   per   Ordinary   Share   (Basic)  19.91  23.62  43.51  27.59  25.61  26.10  32.88  15.72  (40.51)  23.41  30.25  38.98  95.51  45.38   275.02    10.06    49.37

                     1 for 10  3 for 10  1 for 5  1 for 2  2 for 5  1 for 2  3 for 5  Profit for   the Year  ` in lakh  42834  50804  96440  64810  60591  65347  83759  40040  (103200)  59646  77058  99311  243308  115591  700633  25637  125762


                Bonus Issue  1966-67  1968-69  1970-71  1974-75  1985-86  1990-91  1995-96  Share of   Profit/  (Loss) in   Associate  ` in lakh   -    -    -    -    -    -    -   11171  1347  13114   -   19257   (246)  19946   (308)  20703   (333)  22100   (540)  20553   1489   23558   1562   24099   4923   26941   9921   23094   2749   22182   2,562   17985   21,594   14751


                   ` in lakh  48  112  50  104  314  REVENUE ACCOUNTS  Profit   Minority   Taxes  before   Interest  Taxes  ` in lakh  ` in lakh  ` in lakh  17231  60065  24009  74813  21147  117587  15751  91732  20932  93290  27492  112096  34392  138343  30252  91303  28878  (51889)  35112  115851  28732  127859  41807  163655  56935  322261  34359  163123  17933  737999  19777  60837  27979  146898


                         1 for 5 at Prem Re. 0.5 per share 1 for 5 at Prem Re. 0.5 per share  Depreciation  ` in lakh  18404  27388  31383  42264  44678  45105  50868  53388  47124  46314  57137  55244  53059  57139  66647  75932  80612


                     1 for 2 at par  4 for 5 at par   Expenses  ` in lakh  346846  504082  528813  1166716  845176  979211  1232095  1400520  1641748  1606708  1579960  1327495  1218260  1020023  874949  906653  1062033   From year ended March 31, 2011 onwards, borrowing include non-current (long-term) borrowing + non-current leases+ current (short-term) borrowing + current maturity of non-current


                Rights Issue  1954-55  1957-58  1961-62  1972-73  Gross   Revenue   ***  ` in lakh  425315  606283  677783  1300712  983144  1136412  1425027  1545211  1636983  1768873  1764956  1546394  1593580  1240285  1679595  1043422  1289543 Capital Employed: Total Assets minus current liabilities plus current (short-term) borrowing plus current maturities of non-current (long-term) borrowing and lease obligations

                                                     Goodwill on   Consolidation  ` in lakh  70749  76324  464924  562128  532470  563242  635874  662702  672261  695699  176193  169841  173185  181103  195423  191774  1,97,084 From year ended March 31, 2011 onwards, net block includes capital work-in-progress + intangible assets held under development + capital advances


                     8/- per share Premium  `  10/- per share  `  30/- per share  `  40/- per share  `  60/- per share  `  40/- per share  `  40/- per share  `  220.78/- per share  `  220.78/- per share  `  220.78/- per share  `  CAPITAL ACCOUNTS  Net   Capital   Borrowings   block#  Employed  *  ` in lakh  ` in lakh  ` in lakh  277941  430024  182769  305605  469081  186420  337121  885172  480669  376696  1122734  628381  383096  1007837  499372  449047  1161268  56


            FINANCIAL STATISTICS - Standalone  Equity Shares Issued on Conversion of Bonds/Debentures  ` in lakh  116  300  600 1984-85/1985-89  725  725  1960  1960  1889  117  809  9201 FINANCIAL STATISTICS - Consolidated  Minority   Share   Reserves  Interest  Capital  ` in lakh  ` in lakh  ` in lakh   -   200419  21516   -   235666  21516  4234  348439  23406  15219  453455  23523  35006  447310  24332  40645  519687  25482  44809  608145  25482  53614  615874  25


           358       1982-83  1983-84  1987-88  1987-88  1992-93  1993-94  2007-08  2008-09  2009-10  Year  2005-06  2006-07  2007-08  2008-09  2009-10  2010-11  2011-12  2012-13  2013-14  2014-15  2015-16 @  2016-17 @  2017-18 @  2018-19 @  2019-20 @  2020-21 @  2021-22 @  *   #   @    **   ***