
Page 224 - Tata_Chemicals_yearly-reports-2017-18
P. 224
` in crore
Particulars Year ended Year ended
31 March, 2018 31 March, 2017
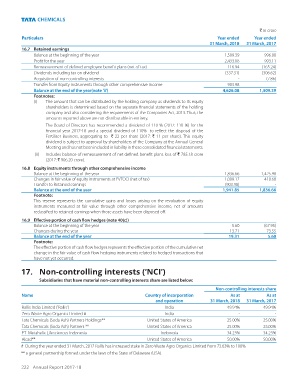
16.7 Retained earnings
Balance at the beginning of the year 1,509.39 996.00
Profit for the year 2,433.08 993.11
Remeasurement of defined employee benefit plans (net of tax) 116.94 (165.24)
Dividends including tax on dividend (337.31) (306.62)
Acquisition of non-controlling interests - (7.86)
Transfer from Equity instruments through other comprehensive income 903.98 -
Balance at the end of the year(note 'ii') 4,626.08 1,509.39
Footnotes:
(i) The amount that can be distributed by the holding company as dividends to its equity
shareholders is determined based on the separate financial statements of the holding
company and also considering the requirements of the Companies Act, 2013. Thus, the
amounts reported above are not distributable in entirety.
The Board of Directors has recommended a dividend of 110 % (2017: 110 %) for the
financial year 2017-18 and a special dividend of 110% to reflect the disposal of the
Fertiliser Business, aggregating to ` 22 per share (2017: ` 11 per share). This equity
dividend is subject to approval by shareholders of the Company at the Annual General
Meeting and has not been included in liability in these consolidated financial statements.
(ii) Includes balance of remeasurement of net defined benefit plans loss of ` 785.18 crore
(2017: ` 906.20 crore).
16.8 Equity instruments through other comprehensive income
Balance at the beginning of the year 1,836.66 1,425.98
Changes in fair value of equity instruments at FVTOCI (net of tax) 1,009.17 410.68
Transfer to Retained earnings (903.98) -
Balance at the end of the year 1,941.85 1,836.66
Footnote:
This reserve represents the cumulative gains and losses arising on the revaluation of equity
instruments measured at fair value through other comprehensive income, net of amounts
reclassified to retained earnings when those assets have been disposed off.
16.9 Effective portion of cash flow hedges (note 40(c))
Balance at the beginning of the year 5.60 (67.95)
Changes during the year 13.71 73.55
Balance at the end of the year 19.31 5.60
Footnote:
The effective portion of cash flow hedges represents the effective portion of the cumulative net
change in the fair value of cash flow hedging instruments related to hedged transactions that
have not yet occurred.
17. Non-controlling interests (‘NCI’)
Subsidiaries that have material non-controlling interests share are listed below:
Non-controlling interests share
Name Country of incorporation As at As at
and operation 31 March, 2018 31 March, 2017
Rallis India Limited (‘Rallis’) India 49.94% 49.94%
Zero Waste Agro Organics Limited # India - -
Tata Chemicals (Soda Ash) Partners Holdings** United States of America 25.00% 25.00%
Tata Chemicals (Soda Ash) Partners ** United States of America 25.00% 25.00%
PT Metahelix Lifesciences Indonesia Indonesia 34.23% 34.23%
Alcad** United States of America 50.00% 50.00%
# During the year ended 31 March, 2017 Rallis has increased stake in Zero Waste Agro Organics Limited from 73.63% to 100%.
** a general partnership formed under the laws of the State of Delaware (USA).
222 Annual Report 2017-18