Page 264 - Tata Chemical Annual Report_2022-2023
P. 264

Integrated Annual Report 2022-23                01-83                   84-192                  193-365
                                                                                                                                     Integrated Report       Statutory Reports       Financial Statements
                                                                                                                                                                                     Standalone


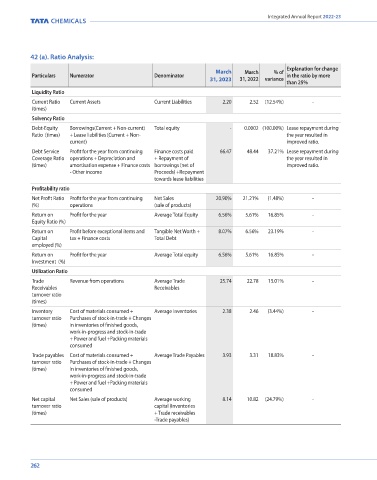
           42 (a). Ratio Analysis:                                                                                                 42 (b). Note on Ultimate Beneficiaries

                                                                                           Explanation for change                       No funds have been advanced or loaned or invested (either from borrowed funds or share premium or any other sources or
                                                                     March    March    % of
           Particulars  Numerator                 Denominator                              in the ratio by more                        kind of funds) by the Company to or in any other person(s) or entity(ies), including foreign entities (“Intermediaries”), with the
                                                                   31, 2023  31, 2022  variance
                                                                                           than 25%                                    understanding, whether recorded in writing or otherwise, that the Intermediary shall directly or indirectly lend or invest in other
           Liquidity Ratio                                                                                                             persons or entities identified in any manner whatsoever by or on behalf of the Company (“Ultimate Beneficiaries”) or provide
                                                                                                                                       any guarantee, security or the like on behalf of the Ultimate Beneficiaries.
           Current Ratio   Current Assets         Current Liabilities   2.20    2.52   (12.54%)    -
           (times)
                                                                                                                                        No funds have been received by the Company from any person(s) or entity(ies), including foreign entities (“Funding Parties”),
           Solvency Ratio                                                                                                              with the understanding, whether recorded in writing or otherwise, that the Company shall directly or indirectly, lend or invest
           Debt-Equity   Borrowings(Current + Non-current)   Total equity   -      0.0002   (100.00%) Lease repayment during           in other persons or entities identified in any manner whatsoever by or on behalf of the Funding Parties (“Ultimate Beneficiaries”)
           Ratio  (times)  + Lease liabilities (Current + Non-                             the year resulted in                        or provide any guarantee, security or the like on behalf of the Ultimate Beneficiaries.
                       current)                                                            improved ratio.
           Debt Service   Profit for the year from continuing   Finance costs paid    66.47    48.44   37.21% Lease repayment during   42 (c). Borrowing based on security of current assets
           Coverage Ratio   operations + Depreciation and   + Repayment of                 the year resulted in                         The Company has obtained borrowings from bank on basis of security of current assets wherein the quarterly returns/ statements
           (times)     amortisation expense + Finance costs  borrowings (net of            improved ratio.                             of current assets as filed with bank are in agreement with the books.
                       - Other income             Proceeds) +Repayment
                                                  towards lease liabilities                                                        42 (d). Transactions with Struck off companies
           Profitability ratio
                                                                                                                                                                       Nature of    Balance    Relationship with   Balance    Relationship
           Net Profit Ratio  Profit for the year from continuing   Net Sales   20.90%  21.21%   (1.48%)  -                                                            transactions    outstanding    the struck off   outstanding    with the struck
           (%)         operations                 (sale of products)                                                                    Name of the struck off Company  with struck off    as at March 31,   Company if any,   as at March 31,   off Company
           Return on   Profit for the year        Average Total Equity  6.56%  5.61%  16.85%       -                                                                   Company       2023      to be disclosed  2022       if any, to be
                                                                                                                                                                                                                           disclosed
           Equity Ratio (%)
                                                                                                                                        NXTGEN Future SCM Private Limited
           Return on   Profit before exceptional items and   Tangible Net Worth +   8.07%  6.56%  23.19%  -                             (CIN:U63000GJ2014PTC079161)    Payable          *           No            *          No
           Capital     tax + Finance costs        Total Debt
           employed (%)                                                                                                                  * value below Rs. 0.50 crore
           Return on   Profit for the year        Average Total equity  6.56%  5.61%  16.85%       -                               42 (e).  Disclosures pursuant to regulation 34 (3) of securities and exchange board of india (listing
           Investment  (%)                                                                                                               obligations and disclosure requirements) regulations, 2015 and section 186 of the companies
           Utilization Ratio                                                                                                             act, 2013.
           Trade       Revenue from operations    Average Trade        25.74    22.78   13.01%     -                                       i)   Investment in perpetual instrument (note 8(b))
           Receivables                            Receivables
           turnover ratio                                                                                                                        Tata International Limited has utilised the funds for its debt refinancing and general corporate purposes. Term of this
           (times)                                                                                                                             investment is perpetual in nature and carries initial interest rate of 9.20% p.a. Maximum balance outstanding during
           Inventory   Cost of materials consumed +   Average Inventories   2.38    2.46    (3.44%)  -                                         the year is  ` 150 crore (2022: Nil)
           turnover ratio   Purchases of stock-in-trade + Changes                                                                          ii)   Investment in Non convertible Debentures - quoted (note 8(c))
           (times)     in inventories of finished goods,
                       work-in-progress and stock-in-trade                                                                                       Surplus funds have been invested with various corporates (un-related parties). It is repayable within 1 year and carries
                       + Power and fuel +Packing materials                                                                                     interest rate in the range of 7.00% to 7.25% p.a. Maximum balance outstanding during the year is  ` 39 crore (2022:
                       consumed                                                                                                                Nil)
           Trade payables  Cost of materials consumed +   Average Trade Payables   3.93    3.31   18.83%  -                                iii)   Inter-corporate Deposits  (note 9)
           turnover ratio   Purchases of stock-in-trade + Changes
           (times)     in inventories of finished goods,                                                                                         Surplus funds have been invested with various corporates (un-related parties). It is repayable within 1 year and carries
                       work-in-progress and stock-in-trade                                                                                     interest rate in the range of 6.65% to 8.15% p.a. Maximum balance outstanding during the year is  ` 350 crore (2022:
                       + Power and fuel +Packing materials                                                                                     Nil)
                       consumed
                                                                                                                                           iv)  Particulars of investments in Subsidiaries, Joint ventures and associates and other investments are given in note 8.
           Net capital   Net Sales (sale of products)  Average working    8.14    10.82   (24.79%)  -
           turnover ratio                         capital (Inventories                                                                     v)    The Company has not provided any guarantee or security covered under Section 186 and accordingly, the disclosure
           (times)                                + Trade receivables                                                                          requirements to that extent does not apply to the Company.
                                                  -Trade payables)
                                                                                                                                           vi)   In line with Circular No 04/2015 issued by Ministry of Corporate Affairs dated 10/03/2015, loans given to employees
                                                                                                                                               as per the Company’s policy are not considered for the purposes of disclosure under Section 186(4) of the Companies
                                                                                                                                               Act, 2013.


           262                                                                                                                                                                                                                    263
   259   260   261   262   263   264   265   266   267   268   269