
Page 255 - Tata Chemical Annual Report_2022-2023
P. 255
Integrated Annual Report 2022-23 01-83 84-192 193-365
Integrated Report Statutory Reports Financial Statements
Standalone
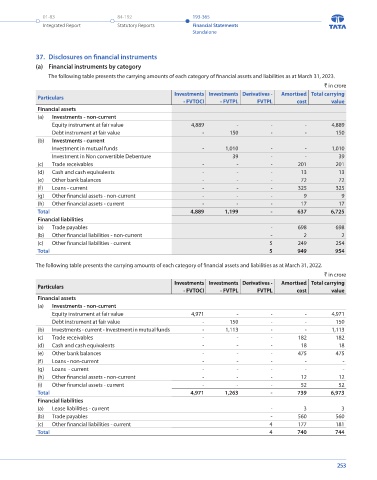
(b) Reconciliation of total assets as per Standalone Balance sheet 37. Disclosures on financial instruments
` in crore (a) Financial instruments by category
As at As at
Particulars The following table presents the carrying amounts of each category of financial assets and liabilities as at March 31, 2023.
March 31, 2023 March 31, 2022
Total assets as per continuing operations (note 35.1 (a) (3)) 17,888 17,017 ` in crore
Total assets as per Standalone Balance sheet 17,888 17,017 Particulars Investments Investments Derivatives - Amortised Total carrying
- FVTOCI - FVTPL FVTPL cost value
(c) Reconciliation of total liabilities as per Standalone Balance sheet Financial assets
` in crore (a) Investments - non-current
As at As at Equity instrument at fair value 4,889 - - - 4,889
Particulars
March 31, 2023 March 31, 2022 Debt instrument at fair value - 150 - - 150
Total liabilities as per continuing operations (note 35.1 (a) (3)) 1,896 1,675 (b) Investments - current
Total liabilities as per Standalone Balance sheet 1,896 1,675 Investment in mutual funds - 1,010 - - 1,010
Investment in Non convertible Debenture 39 - - 39
36. Derivative financial instruments (c) Trade receivables - - - 201 201
(a) The details of the various outstanding derivative financial instruments are given below: (d) Cash and cash equivalents - - - 13 13
` in crore (e) Other bank balances - - - 72 72
As at March 31, 2023 As at March 31, 2022 (f) Loans - current - - - 325 325
Particulars Assets Liabilities Assets Liabilities (g) Other financial assets - non-current - - - 9 9
Current portion (h) Other financial assets - current - - - 17 17
Derivatives not designated in a hedge relationship Total 4,889 1,199 - 637 6,725
- Forward contracts - 5 - 4 Financial liabilities
Total - 5 - 4 (a) Trade payables - 698 698
Although these contracts are effective as hedges from an economic perspective, these are not designated for hedge accounting. (b) Other financial liabilities - non-current - 2 2
(c) Other financial liabilities - current 5 249 254
(b) The details of the gross notional amounts of derivative financial instruments outstanding are given in the table Total 5 949 954
below:
The following table presents the carrying amounts of each category of financial assets and liabilities as at March 31, 2022.
Underlying As at As at
Particulars
(Receivables/payables) March 31, 2023 March 31, 2022 ` in crore
Forward contracts USD/INR $ 77.3 million $ 74.4 million Investments Investments Derivatives - Amortised Total carrying
Forward contracts EUR/INR € 4.0 million € 2.5 million Particulars - FVTOCI - FVTPL FVTPL cost value
Financial assets
(a) Investments - non-current
Equity instrument at fair value 4,971 - - - 4,971
Debt instrument at fair value - 150 - - 150
(b) Investments - current - Investment in mutual funds - 1,113 - - 1,113
(c) Trade receivables - - - 182 182
(d) Cash and cash equivalents - - - 18 18
(e) Other bank balances - - - 475 475
(f) Loans - non-current - - - - -
(g) Loans - current - - - - -
(h) Other financial assets - non-current - - - 12 12
(i) Other financial assets - current - - - 52 52
Total 4,971 1,263 - 739 6,973
Financial liabilities
(a) Lease liabilities - current - 3 3
(b) Trade payables - 560 560
(c) Other financial liabilities - current 4 177 181
Total 4 740 744
252 253