
Page 58 - Tata_Chemicals_yearly-reports-2017-18
P. 58
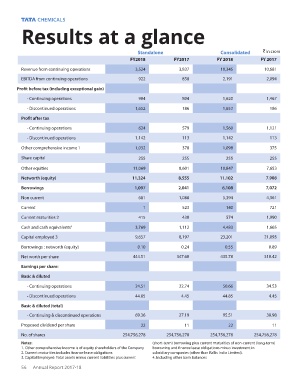
Results at a glance


                                                                 Standalone                       Consolidated    ` in crore
                                                              FY2018           FY2017           FY 2018           FY 2017

                  Revenue from continuing operations            3,524            3,837            10,345           10,681
                  EBITDA from continuing operations              922              858             2,191             2,094

                Prot before tax (including exceptional gain)
                    - Continuing operations                      904              804             1,620             1,467

                    - Discontinued operations                   1,652             186             1,652              186
                  Prot after tax
                    - Continuing operations                      624              579             1,560             1,121

                    - Discontinued operations                   1,142             113             1,142              113

                  Other comprehensive income 1                  1,032             378             1,098              375
                  Share capital                                  255              255               255              255
                  Other equities                               11,069            8,601            10,847            7,653

                  Networth (equity)                           11,324             8,555           11,102             7.908
                  Borrowings                                   1,097             2,041            6,108             7,072

                  Non current                                    681             1,088            5,394             4,361
                  Current                                          1              523               140              721

                  Current maturities 2                           415              430               574             1,990
                  Cash and cash equivalents 4                   3,769            1,112            4,483             1,665

                  Capital employed 3                            9,657            8,197            23,201           21,093
                  Borrowings : networth (equity)                0.10              0.24             0.55              0.89
                  Net worth per share                          444.51           347.60            435.78           310.42

                  Earnings per share:
                  Basic & diluted

                    - Continuing operations                     24.51            22.74            50.66             34.53
                    - Discontinued operations                   44.85             4.45            44.85              4.45

                  Basic & diluted (total)
                    - Continuing & discontinued operations      69.36            27.19            95.51             38.98

                  Proposed dividend per share                     22               11                22               11
                  No. of shares                            254,756,278      254,756,278      254,756,278       254,756,278
                  Notes:                                              (short-term) borrowing plus current maturities of non-current (long-term)
                  1. Other comprehensive Income is of equity shareholders of the Company  borrowing and nance lease obligations minus investment in
                  2. Current maturities includes nance lease obligations  subsidiary companies (other than Rallis India Limited).
                  3. Capital Employed: Total assets minus current liabilities plus current   4. Including other bank balances
                  56   Annual Report 2017-18