
Page 286 - Tata_Chemicals_yearly-reports-2017-18
P. 286
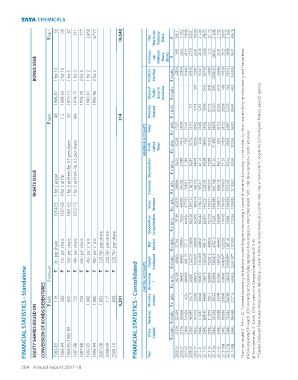
` lakh  30  100  87  311  777  2,458  6,777  10,540  Net   Worth per   Ordinary   Share  `  103.11  119.52  158.96  202.81  193.89  214.00  248.72  251.75  218.46  217.92  269.05  310.42  435.78


               BONUS SSUE  1 for 10  3 for 10  1 for 5  1 for 2  2 for 5  1 for 2  3 for 5  Earnings  Profit for   per   the Year  Ordinary   Share   (Basic)  `  ` in lakhs  19.91  42834  23.62  50804  43.51  96440  27.59  64810  25.61  60591  26.10  65347  32.88  83759  15.72  40040  (40.51) (103200)  23.41  59646  30.25  77058  38.98  99311  95.51 243308


                                                                         -      -      -      -     1347   -      (246)   (308)   (333)   (540)   1489    1562    4923
                        1966-67  1968-69  1970-71  1974-75  1974-75  1990-91  1995-96  Share of   Profit/  (Loss) in   Associate  ` in lakhs   -      -      -

                                                             Minority   Interest  ` in lakhs  11171  13114  19257  19946  20703  22100  20553  23558  24099  26941
                     ` lakh  48  112  50  104     314      REVENUE ACCOUNTS  Taxes  ` in lakhs  17231  60065  24009  74813  21147  117587  15751  91732  20932  93290  27492  112096  34392  138343  30252  91303  28878 (51889)  35112  115851  28732  127859  41807  163655  56935 322261


                             1 for 5 at Prem Re. 0.5 per share 1 for 5 at Prem Re. 0.5 per share  Profit  Depreciation  before   Taxes  ` in lakhs ` in lakhs  18404  27388  31383  42264  44678  45105  50868  53388  47124  46314  57137  55244  53059


               RIGHTS ISSUE  1 for 2 at par  4 for 5 at Par  Expenses  ` in lakhs  346846  504082  528813  1166716  845176  979211  1232095  1400520  1641748  1606708  1579960  1327495  1218260


                        1954-55  1957-58  1961-62  1972-73   Gross   Revenue  ` in lakhs  425315  606283  677783  1300712  983144  1136412  1425027  1545211  1636983  1768873  1764956  1546394  1593580 *From year ended 31 March, 2011 onwards borrowing include non-current (long-term) borrowing + current (short-term) borrowing + current maturity of non-current (long-term) borrowing and finance lease

                                                             Goodwill on   Consolidation  ` in lakhs  70749  76324  464924  562128  532470  563242  635874  662702  672261  695699  176193  169841  173185 ** Capital Employed: Total Assets minus current liabilities plus current (short-term) borrowing plus current Maturities of non-current (long-term) borrowing and finance lease obligations


                        8/- per share  10/- per share  30/- per share  40/- per share  60/- per share  40/- per share  40/- per share  220.78/- per share  220.78/- per share  220.78/- per share  Net   Capital   block # Employed  ` in lakhs ` in lakhs  277941 430024  305605  469081  337121  885172  376696  1122734  383096 1007837  449047  1161268  495141  1381258  468350  1532813  476215 1480479  460432  1481024  1202595 2164099**  1183144 2109338**  1157090 2320108**


                     Premium  ` lakh  `  116  `  300  `  600  `  725  `  725  `  1,960  `  1,960  `  1,889  `  117  `  809  9,201  CAPITAL ACCOUNTS  Borrowings  Minority   *  Interest  ` in lakhs ` in lakhs  182769   -     186420   -     480669  4234  628381  15219  499372  35006  569972  40645  706073  44809  838400  53614  839306  65522  837884  67349  909042  259846  744256  262389  641825 271716 @ From year ended 31 March, 2016 onwards, the Company has followed IN
           FINANCIAL STATISTICS - Standalone


               EQUITY SHARES ISSUED ON CONVERSION OF BONDS/DEBENTURES  1984-85/1985-89  FINANCIAL STATISTICS - Consolidated  Reserves  Share   Capital  ` in lakhs ` in lakhs  200419  21516  235666  21516  348439  23406  453455  23523  447310  24332  519687  25482  608145  25482  615874  25482  531069  25482  529689  25482  659950  25482  765342  25482  1084689  25482


                                1987-88
                        1982-83
                          1983-84

          284 Annual Report 2017-18 1987-88  1992-93  1993-94  2007-08  2008-09  2009-10  Year  2005-06  2006-07  2007-08  2008-09  2009-10  2010-11  2011-12  2012-13  2013-14  2014-15  2015-16@  2016-17@  2017-18@