
Page 261 - Tata_Chemicals_yearly-reports-2017-18
P. 261
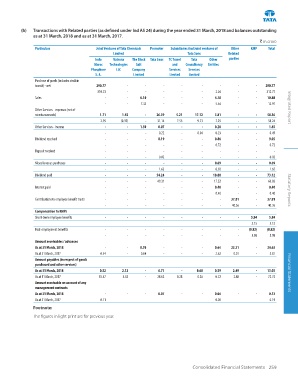
(b)   Transactions with Related parties (as defined under Ind AS 24) during the year ended 31 March, 2018 and balances outstanding
              as at 31 March, 2018 and as at 31 March, 2017.
                                                                                                         ` in crore
               Particulars             Joint Ventures of Tata Chemicals   Promoter  Subsidiaries And Joint ventures of   Other   KMP  Total
                                              Limited                       Tata Sons       Related
                                       Indo   Natronx   The Block   Tata Sons  TC Travel   Tata   Other   parties
                                       Maroc   Technologies   Salt    and   Consultancy   Entities
                                     Phosphore   LLC  Company       Services   Services
                                       S. A.          Limited        Limited  Limited
               Purchase of goods (includes stock in
               transit) - net           290.77      -       -      -      -       -      -       -      -      290.77
                                         310.73     -       -      -      -       -      2.04    -      -      312.77
               Sales                        -       -      6.10    -      -       -      4.78    -      -      10.88
                                            -       -      7.33    -      -       -      5.64    -      -      12.97
               Other Services - expenses (net of                                                                    Integrated Report
               reimbursements)            1.71    1.92      -      26.59    5.21    17.12    5.81    -      -      58.36
                                          2.95    (0.39)    -      31.14    7.56    9.73    7.25    -      -      58.24
               Other Services - Income      -       -      1.50    0.07    -      -      0.28    -      -      1.85
                                            -       -       -      0.22    -      0.04    0.23    -      -      0.49
               Dividend received            -       -       -      8.19    -      -      0.86    -      -      9.05
                                            -       -       -      -      -       -      0.72    -      -      0.72
               Deposit received             -       -       -      -      -       -      -       -      -      -
                                            -       -       -      0.02    -      -      -       -      -      0.02
               Miscellaneous purchases      -       -       -      -      -       -      0.69    -      -      0.69
                                            -       -       -      1.63    -      -      0.02    -      -      1.65
               Dividend paid                -       -       -      54.24    -      -      18.88    -      -      73.12
                                            -       -       -      49.31    -      -      17.52    -      -      66.83
               Interest paid                -       -       -      -      -       -      0.40    -      -      0.40   Statutory Reports
                                            -       -       -      -      -       -      0.40    -      -      0.40
               Contributions to employee benefit trusts   -      -      -      -      -      -      -      37.81    -      37.81
                                            -       -       -      -      -       -      -      40.36    -      40.36
               Compensation To KMPs
               Short-term employee benefits   -      -      -      -      -       -      -       -      5.84    5.84
                                                                                                     5.15    5.15
               Post-employment benefits     -       -       -      -      -       -      -       -      (0.82)   (0.82)
                                            -       -       -      -      -       -      -       -      3.98    3.98
               Amount receivables / advances
               As at 31 March, 2018        -        -    0.70     -      -       -     0.64  23.31     -    24.65
               As at 31 March, 2017      0.54       -    0.64     -      -       -     2.62   0.01      -     3.81
               Amount payables (in respect of goods
               purchased and other services)
               As at 31 March, 2018      0.52     2.12     -    6.71     -     0.60    0.59   2.49     -    13.03   Financial Statements
               As at 31 March, 2017     35.47     4.52      -     28.62  0.28   0.26   0.72   2.88      -     72.75
               Amount receivable on account of any
               management contracts
               As at 31 March, 2018        -        -      -    0.07     -       -     0.06     -      -    0.13
               As at 31 March, 2017      0.11       -      -      -      -       -     0.08     -      -     0.19
              Footnote:
              The figures in light print are for previous year.


                                                                              Consolidated Financial Statements 259