Page 297 - Tata_Chemicals_yearly-reports-2019-20
P. 297

Integrated report             Statutory reportS          Financial StatementS
                                                                                   Consolidated


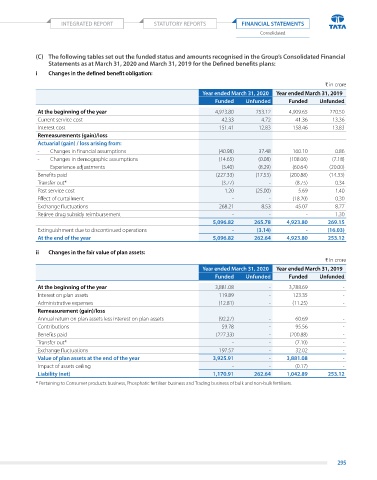
            (C)   The following tables set out the funded status and amounts recognised in the Group’s Consolidated Financial
                Statements as at March 31, 2020 and March 31, 2019 for the Defined benefits plans:
            i   Changes in the defined benefit obligation:
                                                                                                        ` in crore
                                                                 Year ended March 31, 2020  Year ended March 31, 2019
                                                                     Funded    Unfunded      Funded    Unfunded
             At the beginning of the year                            4,923.80     253.12     4,909.65    270.50
             Current service cost                                       42.33       4.72       41.36      13.36
             Interest cost                                             151.41      12.83      158.46      13.83
             Remeasurements (gain)/loss
             Actuarial (gain) / loss arising from:
             -   Changes in financial assumptions                      (40.98)     37.48      160.10       0.86
             -   Changes in demographic assumptions                    (14.65)     (0.08)    (108.06)     (7.18)
             -   experience adjustments                                (3.40)      (8.29)     (60.64)    (20.00)
             Benefits paid                                            (227.33)    (17.53)    (200.88)    (14.33)
             transfer out*                                             (3.77)         -        (8.75)      0.34
             past service cost                                          1.20      (25.00)       5.69       1.40
             effect of curtailment                                         -          -       (18.20)      0.30
             exchange fluctuations                                     268.21       8.53       45.07       8.77
             retiree drug subsidy reimbursement                            -          -           -        1.30
                                                                     5,096.82     265.78    4,923.80     269.15
             extinguishment due to discontinued operations                 -       (3.14)         -      (16.03)
             At the end of the year                                  5,096.82     262.64    4,923.80     253.12

            ii   Changes in the fair value of plan assets:
                                                                                                        ` in crore
                                                                 Year ended March 31, 2020  Year ended March 31, 2019
                                                                     Funded    Unfunded      Funded    Unfunded
             At the beginning of the year                            3,881.08         -      3,788.69         -
             Interest on plan assets                                   119.89         -       123.35          -
             administrative expenses                                   (12.81)        -       (11.25)         -
             Remeasurement (gain)/loss
             annual return on plan assets less interest on plan assets   (92.27)      -        60.69          -
             Contributions                                              59.78         -        95.56          -
             Benefits paid                                            (227.33)        -      (200.88)         -
             transfer out*                                                 -          -        (7.10)         -
             exchange fluctuations                                     197.57         -        32.02          -
             Value of plan assets at the end of the year             3,925.91         -      3,881.08         -
             Impact of assets ceiling                                      -          -        (0.17)         -
             Liability (net)                                         1,170.91     262.64    1,042.89     253.12
            * pertaining to Consumer products business, phosphatic fertiliser business and trading business of bulk and non-bulk fertilisers.


                                                                                                           295
   292   293   294   295   296   297   298   299   300   301   302